The Pie chart assists in explaining complex data using an easy-to-understand visual diagram. It is commonly used to describe numeric data with different values.
The pie chart graphics, however, apply to qualitative data as well. Professionals of every kind of industry use pie charts for reporting purposes. The circular segments in the infographic pie chart enable them to discuss a variety of statistical reports using PowerPoint or Google Slides.
Apart from illustrating key points and scale of data, the template of 3D pie chart helps define a flow of processes in a creative circular sequence.
About segmented infographic pie chart presentation template
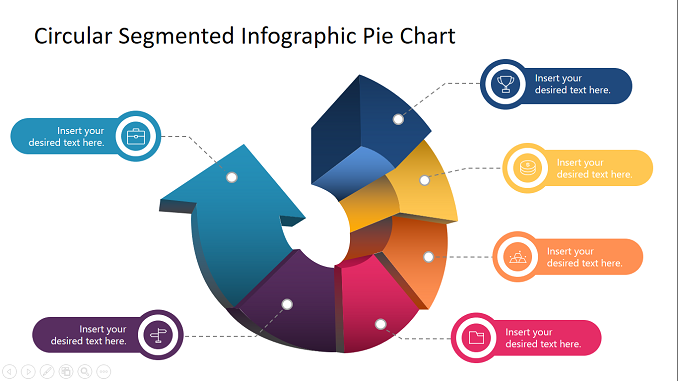
The Free Circular Segmented Infographic Pie Chart for PowerPoint is a 3D arrows diagram template that you can use to prepare presentations. It is a 6 steps arrow process in the shape of the pie chart. Each step shows a portion of a pie chart with dotted labels and bulletins.
These bulletins contain text placeholders and clipart icons for graphic representation of each heading. Altogether, the pie chart template provides an infographic diagram design in PowerPoint. The additional six slides are useful when you need to discuss each item of pie chart in detail.
These slides highlight one unit of the arrow pie chart in color while graying out the rest. In this way, the audience will focus on one part of the topic during a presentation.
Features of this presentation infographics design
- 100% Editable PowerPoint Templates.
- Compatible with all major Microsoft PowerPoint versions, Keynote and Google Slides.
- Modern 16:9 Aspect Ratio.
- Scalable Vectoral PowerPoint Shapes and PowerPoint Icons.
- Instant Access and Download.
- Use of Calibri font and Arial Black font for high quality.
Download and Use Segmented infographic Pie Chart
You can download the template design free of cost and customize it with Microsoft PowerPoint. Alternatively, you can find more Business related to PowerPoint background designs on this website.
To download and use this presentation template, follow the steps below :
- Download this presentation template by hitting the “Download” Button in this page.
- Use decompressor software like 7zip nd WinRAR to extract the zipped file of this presentation template.
- To use this presentation, you must have Google Slides access or Microsoft PowerPoint.
- Open the presentation with PowerPoint or Upload it in Google Drive to open with Google Slides.
The Free Circular Segmented Infographic Pie Chart is a multicolor diagram template, which can be customized. You can change the colors of segmented shapes or change icons that suit the presentation topic.
One example of a pie chart application is performance report where company displays staff activity, project processes, goals, and resource spending.
The Infographic pie chart in PowerPoint gives a visual aid to describe status of these components. You can present the duration of project, financials, clients, and customers in a visually appealing layout.


