
Single Slide
Profit And Loss Statement Infographic
Profit And Loss Statement PPT Slide For PowerPoint and Google Slides Presentation, the modern and free design and characterized by ease of modification and coloring
Profit And Loss Statement PPT Slide For PowerPoint and Google Slides Presentation, the modern and free design and characterized by ease of modification and coloring

The medical field is one of the widest markets in the world either if it is governmental or private. and if you work in it,
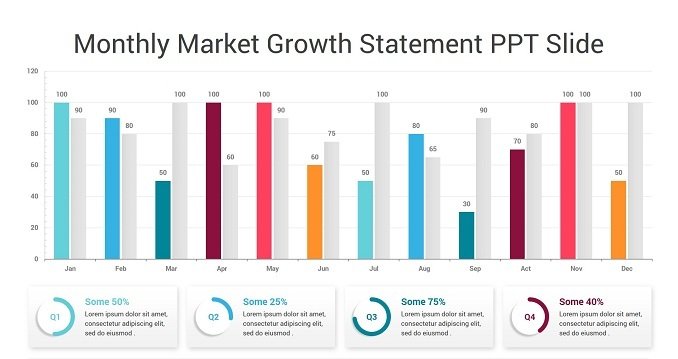
This presentation design is easy to use with anything that needs a monthly graph to describe it, like beneficiary or availability or even customers that
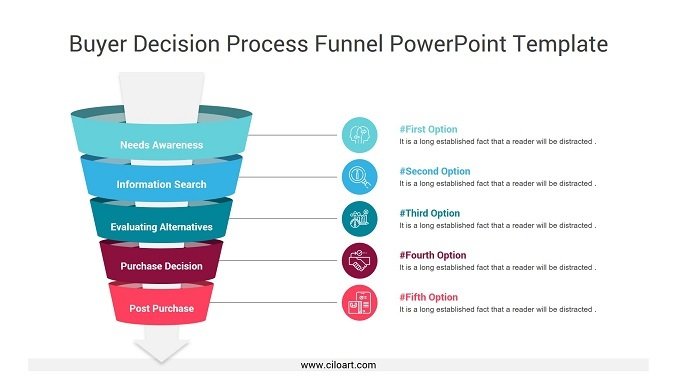
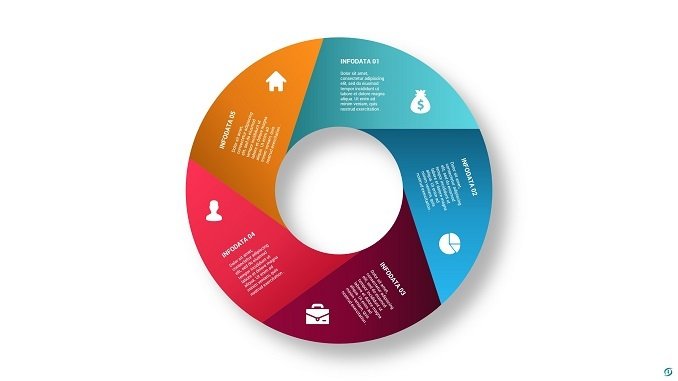
This template was drawn as a circle shaped funnel so it gives the feeling of circular flow and shows how smooth the operation is. With
This template is great for presentations on business, products, and services. Like, sales campaigns, CRM proposals and other similar projects that require a continued shape.
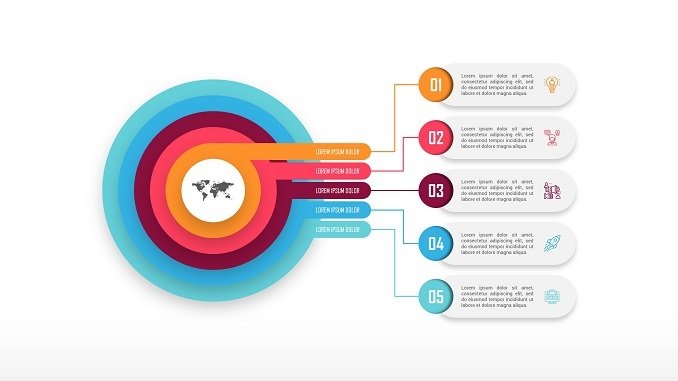
This infographic could be used in business different sections like Sales, PR, HR, and Management. to show ascending and growth of your sales, access, incomes,
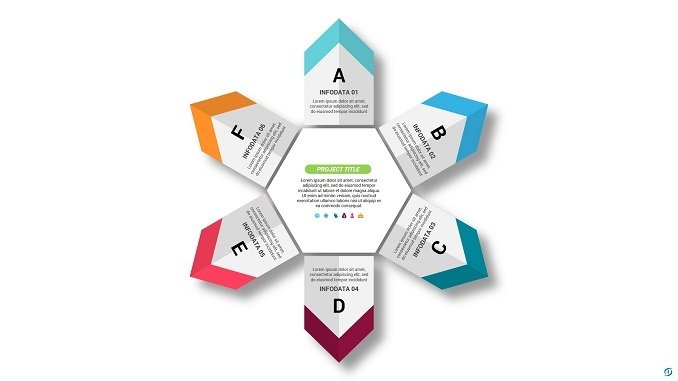
This infographic template consists of five circles continued with lines, giving every title some independence but keeping all of things united. And the lines to
Rankings or levels or team information. For marketing purposes or public relations. You’ll need great art to describe things right. So welcome to this template

Tree diagrams are usually used with things that have various subcategories, or something that have more of a point or definition. So you can use
Circle Folded Infographic Template is a free process, stair step, agenda, business summary, objectives presentation template for Microsoft PowerPoint and Google Slides. It comes with
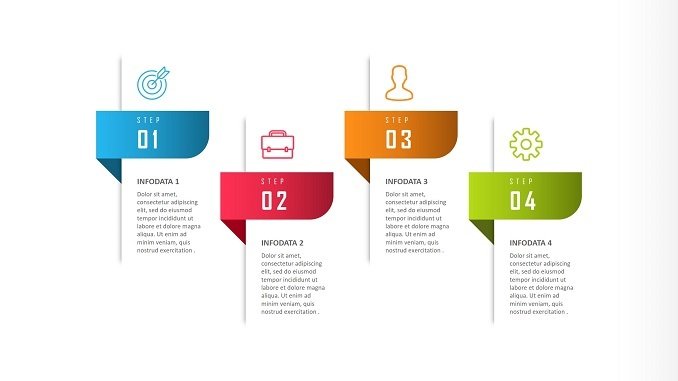
For business insiders from employees to employers looking to look practical but also cool. If you looking for something That describes four points. S.W.O.T or
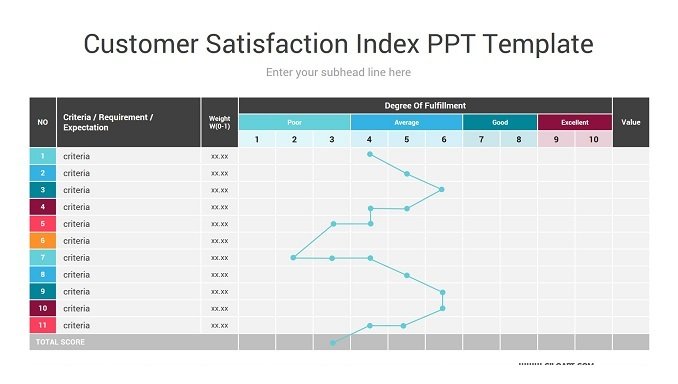
Infographic Customer Satisfaction Index presentation has a formal design that looks like an excel sheet divided so you can put all the criteria that you