
Single Slide
Dark Pie Chart 3 Periods
This pie chart circular presentation template comes with dark background. There are THREE levels or periods which can be useful in defining various topics in
This pie chart circular presentation template comes with dark background. There are THREE levels or periods which can be useful in defining various topics in

Boston BCG Matrix PowerPoint template is relevant to the BCG Matrix for a PowerPoint presentation. The BCG Matrix template is very easy to use and
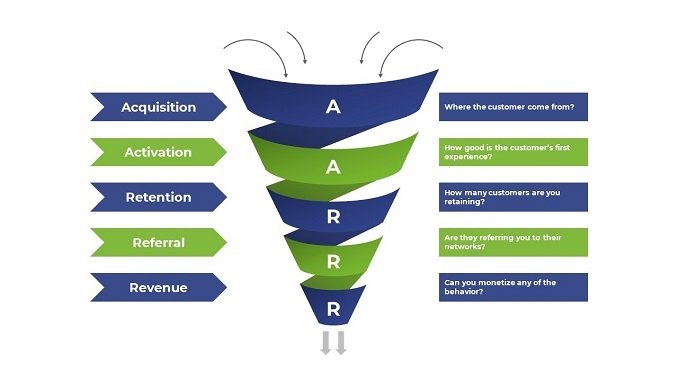
AARRR stands for acquisition, activation, retention, revenue and referral and basically describes a funnel. Optimizing this AARRR funnel will help you understand your customers’ journey and

Circle Comparison Infographic Template Free Download design to convert your data visually into an amazing presentation. With fully editable slides and colors this presentation template

Yes No Flowchart infographics PowerPoint Template is useful for showcasing the decision making process, alternative processes, opportunity cost visualization and many more. This Infographic Template

Project Planning Implementation Timeline PowerPoint Infographic Template is useful in visualization of implementation status of your monthly project related activities. This Infographic Template is a
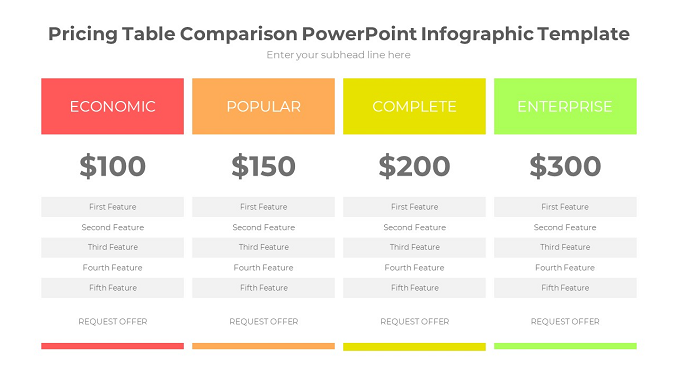
Pricing Table Comparison PowerPoint Infographic Template with 4 Boxes with features to convert your data visually into an amazing infographic presentation. This Infographic Template is a
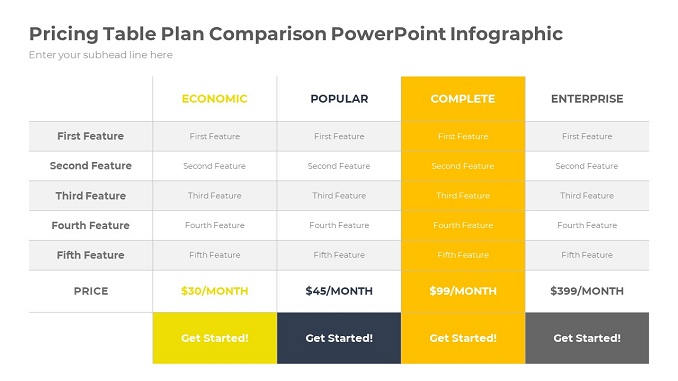
Pricing Table Plan Comparison PowerPoint Infographic Template with 4 Boxes with features to convert your data visually into an amazing infographic presentation. This Infographic Template is
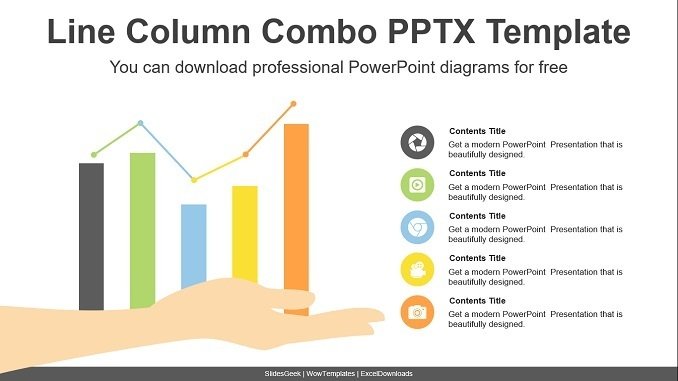
Use the Line Column Combo in your presentations to showcase visualization of data and analytics. You can use the combination of line diagram and column
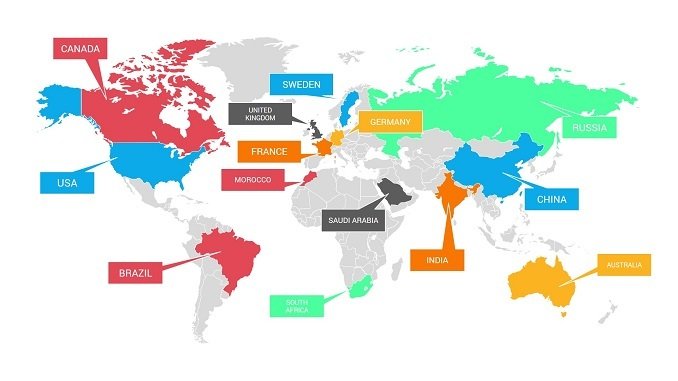
Now you can get the world map and download it for free, without any additional fees, in high quality, and with a unique design as

Free PESTEL PowerPoint Template is a presentation design that you can use to present PESTEL analysis. PESTEL stands for Political, Economic, Social, Technological, Environment and
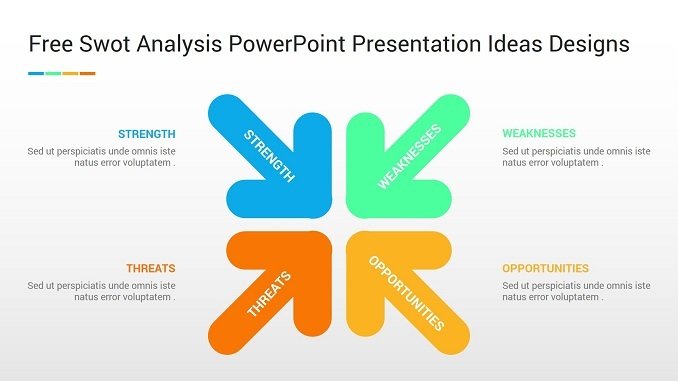
Free SWOT Analysis PowerPoint Presentation Ideas Designs will help you to perform your presentation depending on analysis of project and process evaluation, by using free