Single Slide
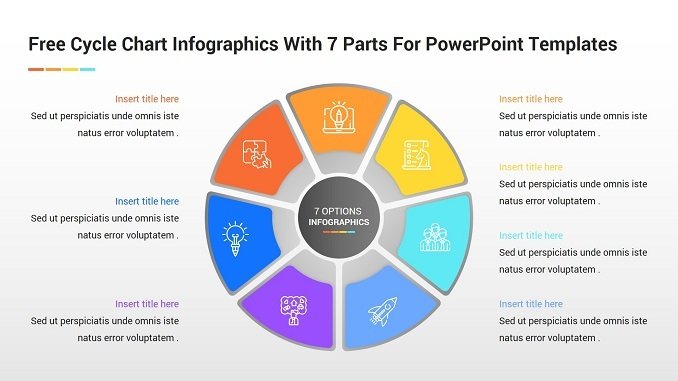
7 Parts Cycle Chart
Free cycle chart Infographics with 7 parts for PowerPoint and Google Slides templates. an elegant and attractive colorful cyclic process, Each part of the series
Free cycle chart Infographics with 7 parts for PowerPoint and Google Slides templates. an elegant and attractive colorful cyclic process, Each part of the series
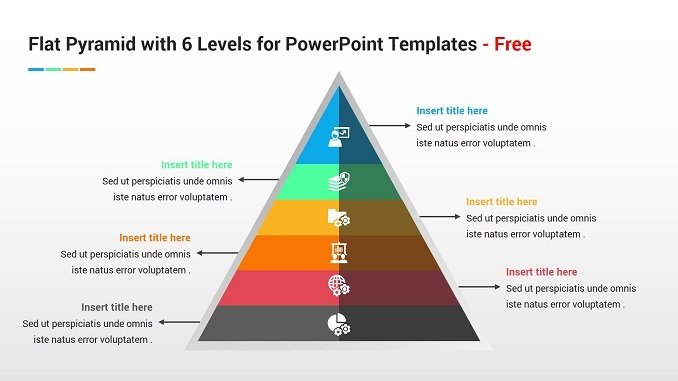
Free Flat Pyramid With 6 Levels For PowerPoint and Google Slides templates. an elegant and attractive colorful Pyramid process, Each part of the series contains
Free Modern Pie Chart Infographic PowerPoint PPT Template, the modern design, as is evident in the preview image shown, consists of 10 steps in the
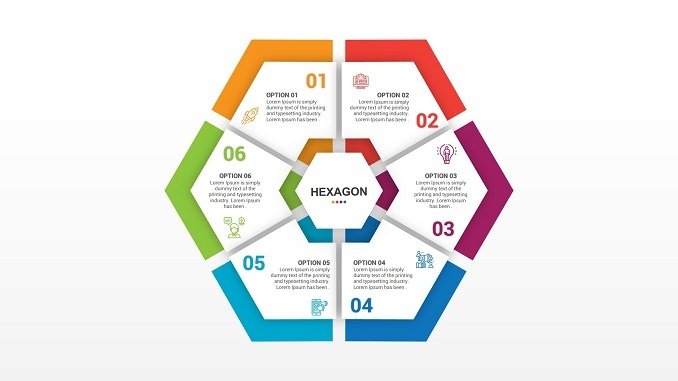
Free Hexagon With Six Options Infographic PowerPoint PPT Template, the modern design, as is evident in the preview image shown, consists of 6 separate hexagon
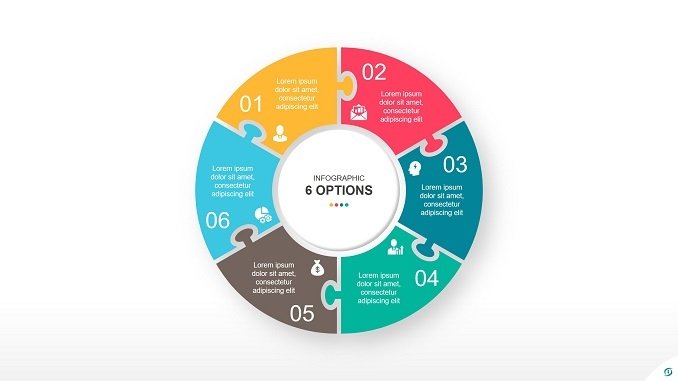
Free Circle Puzzle 6 Periods PowerPoint Infographic Template, the modern and free design, as is evident in the preview image shown, consists of 6 puzzles

Free Circle Chart infographic PowerPoint Template, the modern and free design, as is evident in the preview image shown, consists of 6 options and characterized
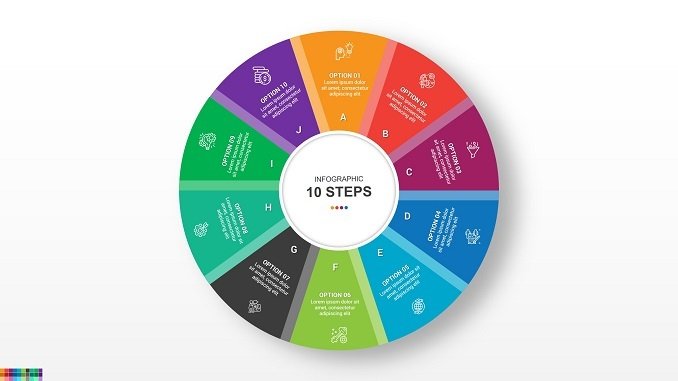
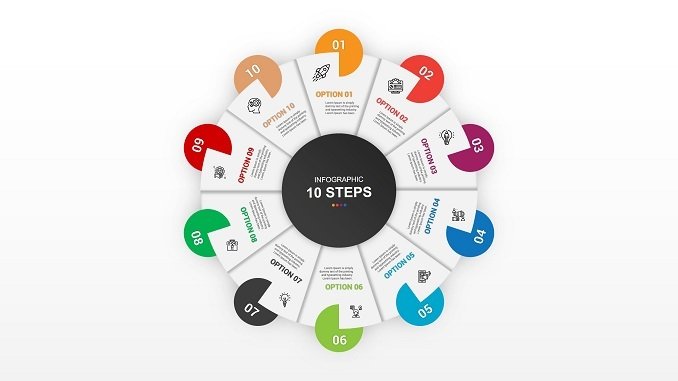
Free 10 Steps Modern Circle Chart PPTX Infographics, the modern and free design, as is evident in the preview image shown, consists of 10 Steps

Free Market Segmentation Slide For PowerPoint and Google Slides Presentation, the modern and free design and characterized by ease of modification and coloring and can

Profit And Loss Statement PPT Slide For PowerPoint and Google Slides Presentation, the modern and free design and characterized by ease of modification and coloring
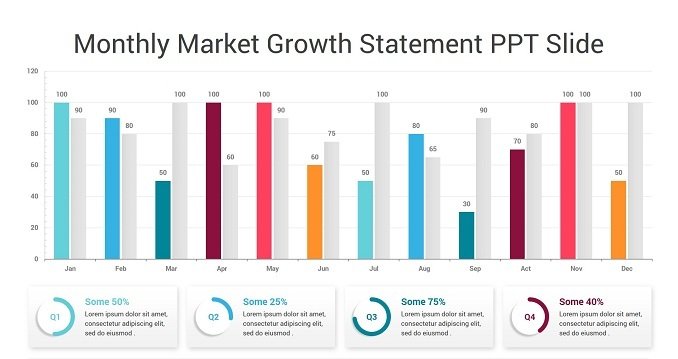
This presentation design is easy to use with anything that needs a monthly graph to describe it, like beneficiary or availability or even customers that
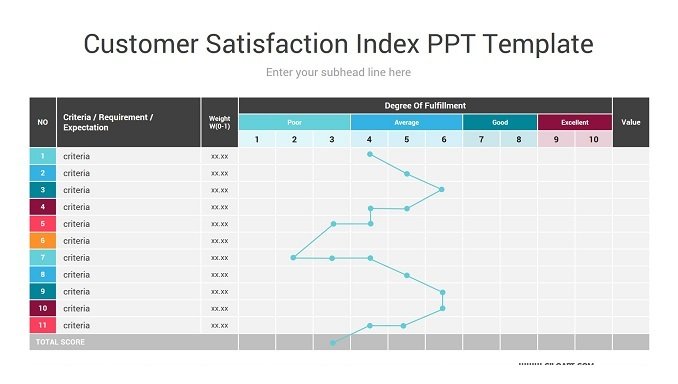
Infographic Customer Satisfaction Index presentation has a formal design that looks like an excel sheet divided so you can put all the criteria that you

This Infographic Template is a free process, stair step, agenda, business summary, objectives presentation template for Microsoft PowerPoint and Google Slides. It comes with info