Single Slide
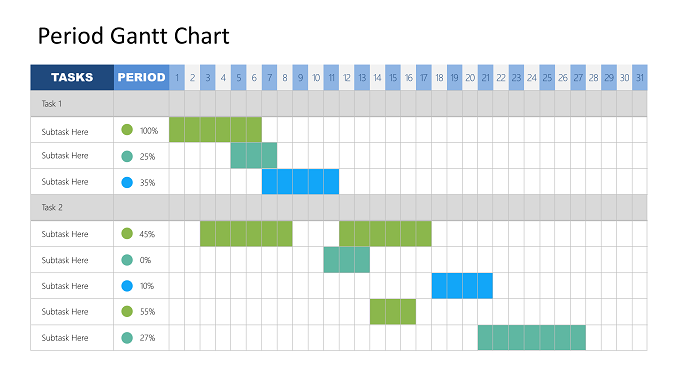
Period Gantt Chart
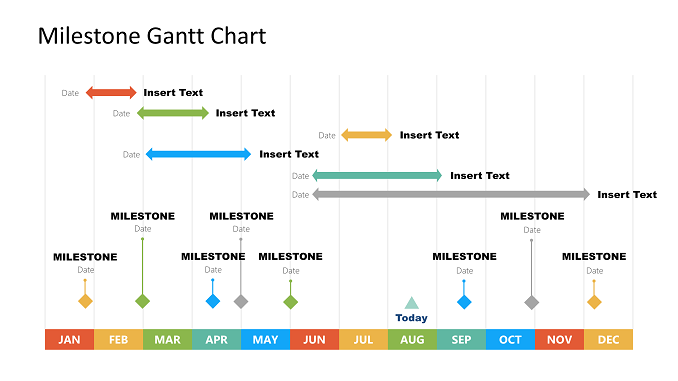
The Free Gantt Chart PowerPoint Templates are easy-to-use slides with attractive designs. Alternative to the simple Gantt charts in project management applications, these templates are
The Free Gantt Chart PowerPoint Templates are easy-to-use slides with attractive designs. Alternative to the simple Gantt charts in project management applications, these templates are

What is Gantt Chart ? Gantt Chart is a chart in which a series of horizontal lines shows the amount of work done or production completed
Gantt chart templates are ideal for providing an estimate of project delivery. You can use Gantt chart template to present how long it will take
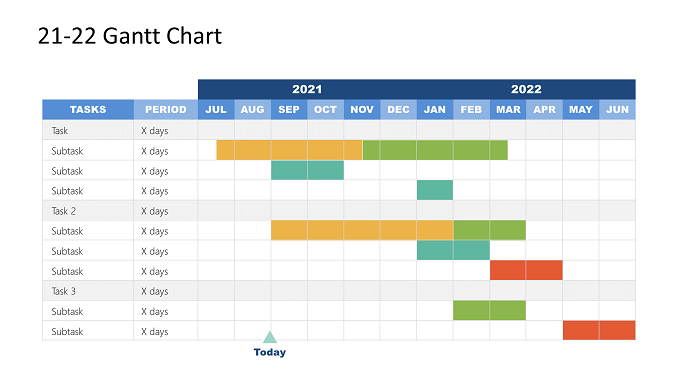
What is Gantt Chart ? Gantt Chart is a chart in which a series of horizontal lines shows the amount of work done or production completed

What is Gantt Chart ? Gantt Chart is a chart in which a series of horizontal lines shows the amount of work done or production completed
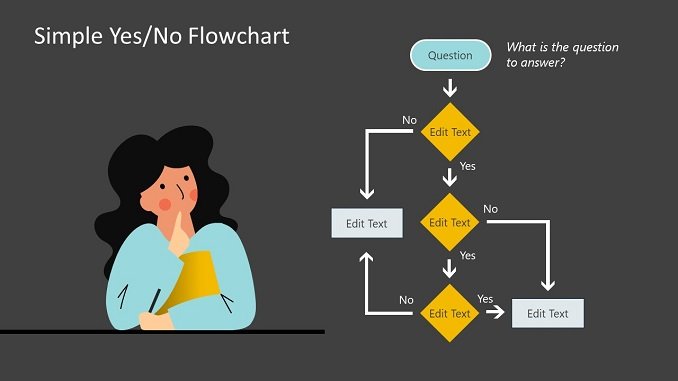
The Simple Yes/No Flowchart PowerPoint Template is a set of creative designs for workflow logic. There are five slide templates containing vertical and horizontal flow

Thailand is a Southeast Asian country. It’s known for tropical beaches, opulent royal palaces, ancient ruins and ornate temples displaying figures of Buddha. In Bangkok,
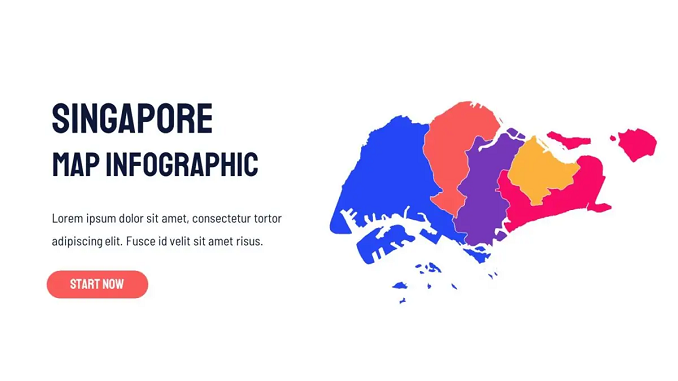
This Singapore Map Infographic template is a country map presentation design. It is useful for Presentations in PowerPoint and Google Slides. This template is useful while
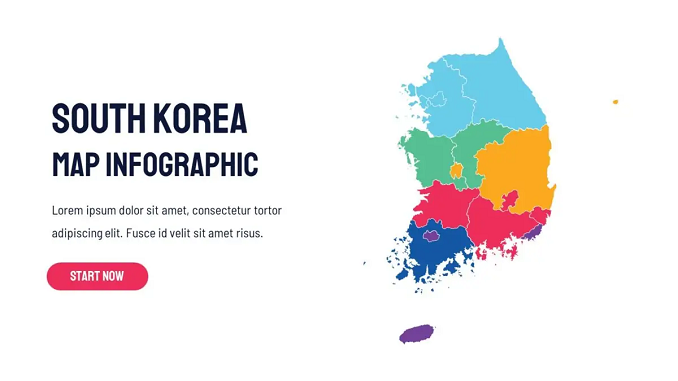
South Korea, an East Asian nation on the southern half of the Korean Peninsula, shares one of the world’s most heavily militarized borders with North

This Russia Map Infographic template is a country map presentation design. It is useful for Presentations in PowerPoint and Google Slides. This template is useful while

This Portugal Map Infographic template is a country map presentation design. It is useful for Presentations in PowerPoint and Google Slides. This template is useful while
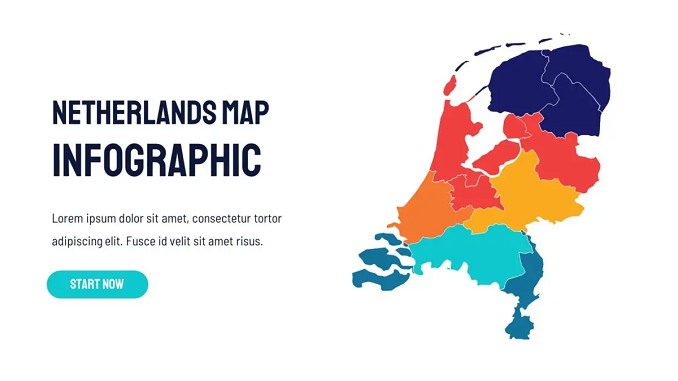
This Netherlands Map Infographic template is a country map presentation design. It is useful for Presentations in PowerPoint and Google Slides. This template is useful