The Free Gantt Chart PowerPoint Templates are easy-to-use slides with attractive designs. Alternative to the simple Gantt charts in project management applications, these templates are designed to engage an audience.
The Gantt chart template of two and three-year projects are useful for presenting multiple projects simultaneously. The colorful bars for every process or tasks help identify dependencies and priorities easily.
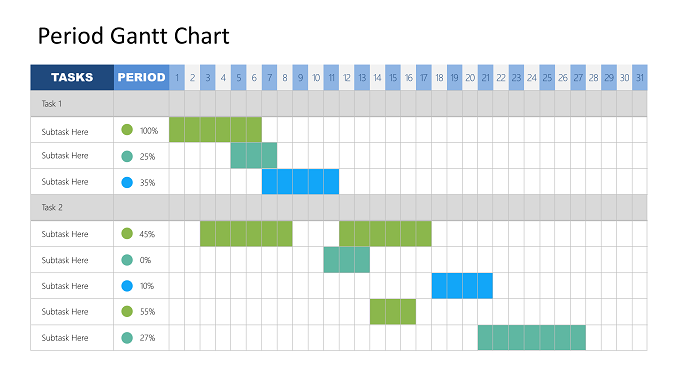
This template focuses mainly in the periods for a project. Projects are usually divided into activities and periods. Project management and reporting becomes easier with various periods. This template comes with default 31 periods.
What is Gantt Chart ?
Gantt Chart is a chart in which a series of horizontal lines shows the amount of work done or production completed in certain periods of time in relation to the amount planned for those periods.
Gantt Charts are an essential project management tool used in time scheduling and resource management.
The purpose of the Gantt chart is to provide a timeline of processes that shows overlapping activities and assigned resources. In this way, the team can quickly see the status of activities, deadlines, and assigned roles for effective management.
Check out excel Gantt chart templates for plotting the time scheduling and resource management.
About Period Gantt Chart Presentation Template
The Free Gantt Chart PowerPoint Templates is an incredible layout designs for project planning and reporting presentations. The project information presented through Gantt chart templates helps simplify complex actions at a glance.
Users can add the Gantt chart in status report presentations or team strategy planning. It can assist in communicating different aspects of a project or venture in a single Gantt chart template.
With this presentation Gantt Chart Template, you can organize and track multiple activities in a high-level visual overview of the project strategy. Simply input tasks schedule data on the data tables and customize the taskbars according to the duration of work. The editing features enable users to make changes in the duration of tasks to avoid overlapping resources.
Features of Periods Gantt Chart Template
- 100% Editable PowerPoint Templates.
- Easy to showcase periods for a project
- 31 periods definable
- Compatible with all major Microsoft PowerPoint versions, Keynote and Google Slides.
- Modern 16:9 Aspect Ratio.
- Scalable Vectoral PowerPoint Shapes and PowerPoint Icons.
- Instant Access and Download.
- Use of Calibri font and Arial Black font for high quality.
Download and Use Free Periods Gantt Chart Template
You can download the template design free of cost and customize it with Microsoft PowerPoint. Alternatively, you can find more Business related to PowerPoint background designs on this website.
To download and use this presentation template, follow the steps below :
- Download this presentation template by hitting the “Download” Button in this page.
- Use decompressor software like 7zip nd WinRAR to extract the zipped file of this presentation template.
- To use this presentation, you must have Google Slides access or Microsoft PowerPoint.
- Open the presentation with PowerPoint or Upload it in Google Drive to open with Google Slides.
