
Single Slide
6 Folded Stages Flow
Creative 6 Folded Stages Free PowerPoint Infographic to convert your data visually into an amazing presentation. With fully editable slides, infographics, and diagrams. This Infographic Template
Creative 6 Folded Stages Free PowerPoint Infographic to convert your data visually into an amazing presentation. With fully editable slides, infographics, and diagrams. This Infographic Template
Creative 4 Steps Horizontal Arrow Process Infographic to convert your data visually into an amazing presentation. With fully editable slide. This Infographic Template is a free
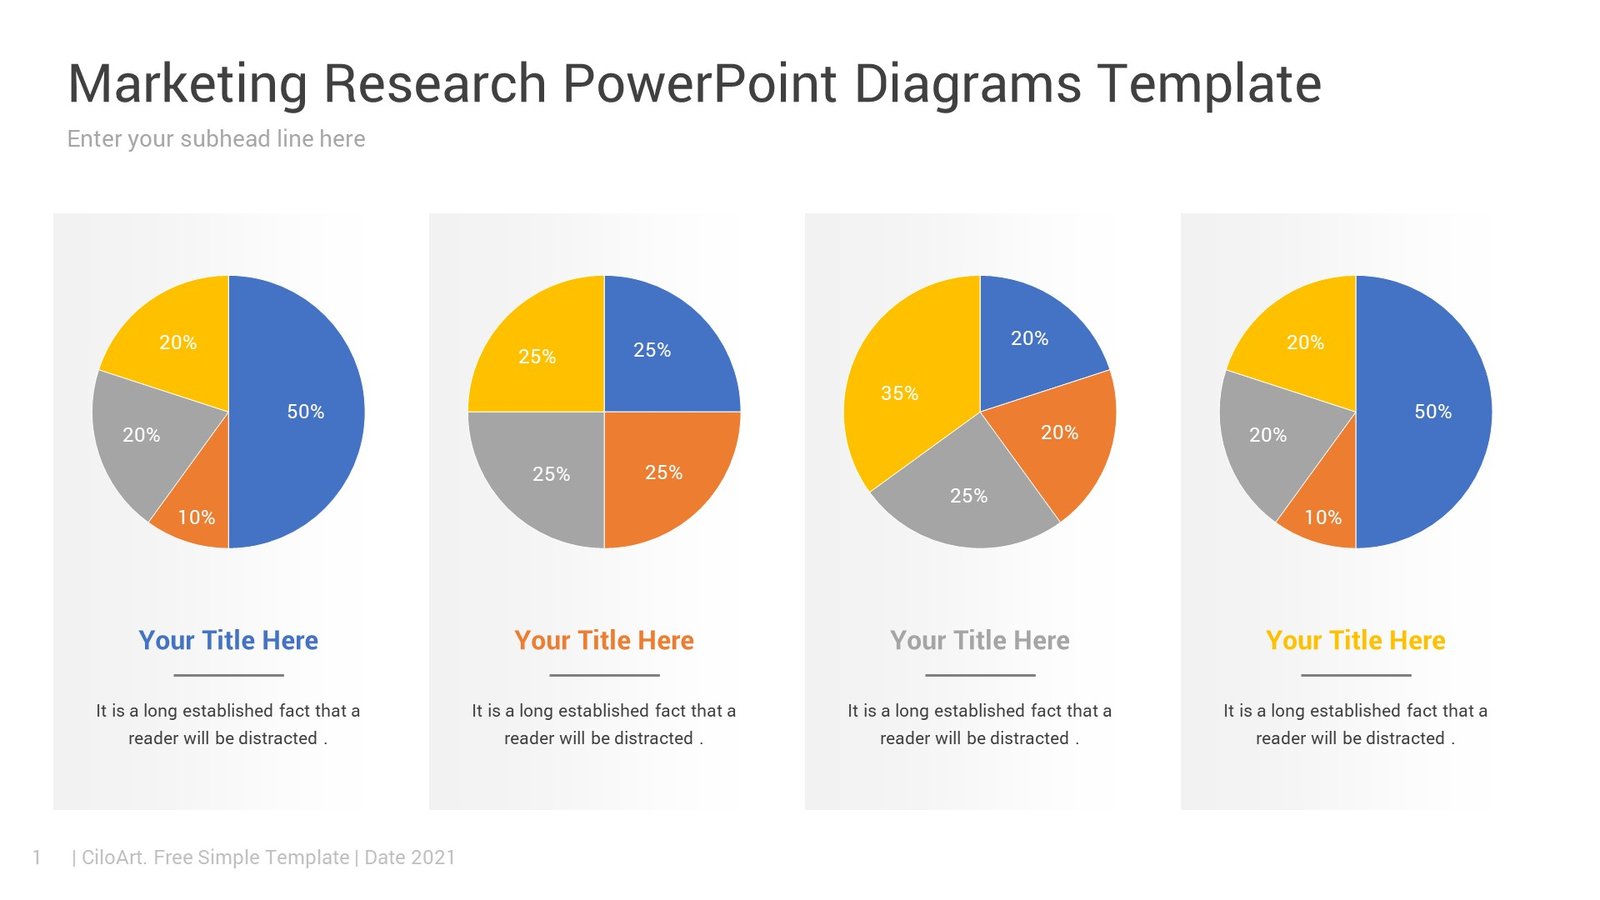
Marketing Research PowerPoint Diagrams Template to convert your data visually into an amazing presentation. With fully editable slides, infographics, and diagrams. Marketing Research Results Infographics
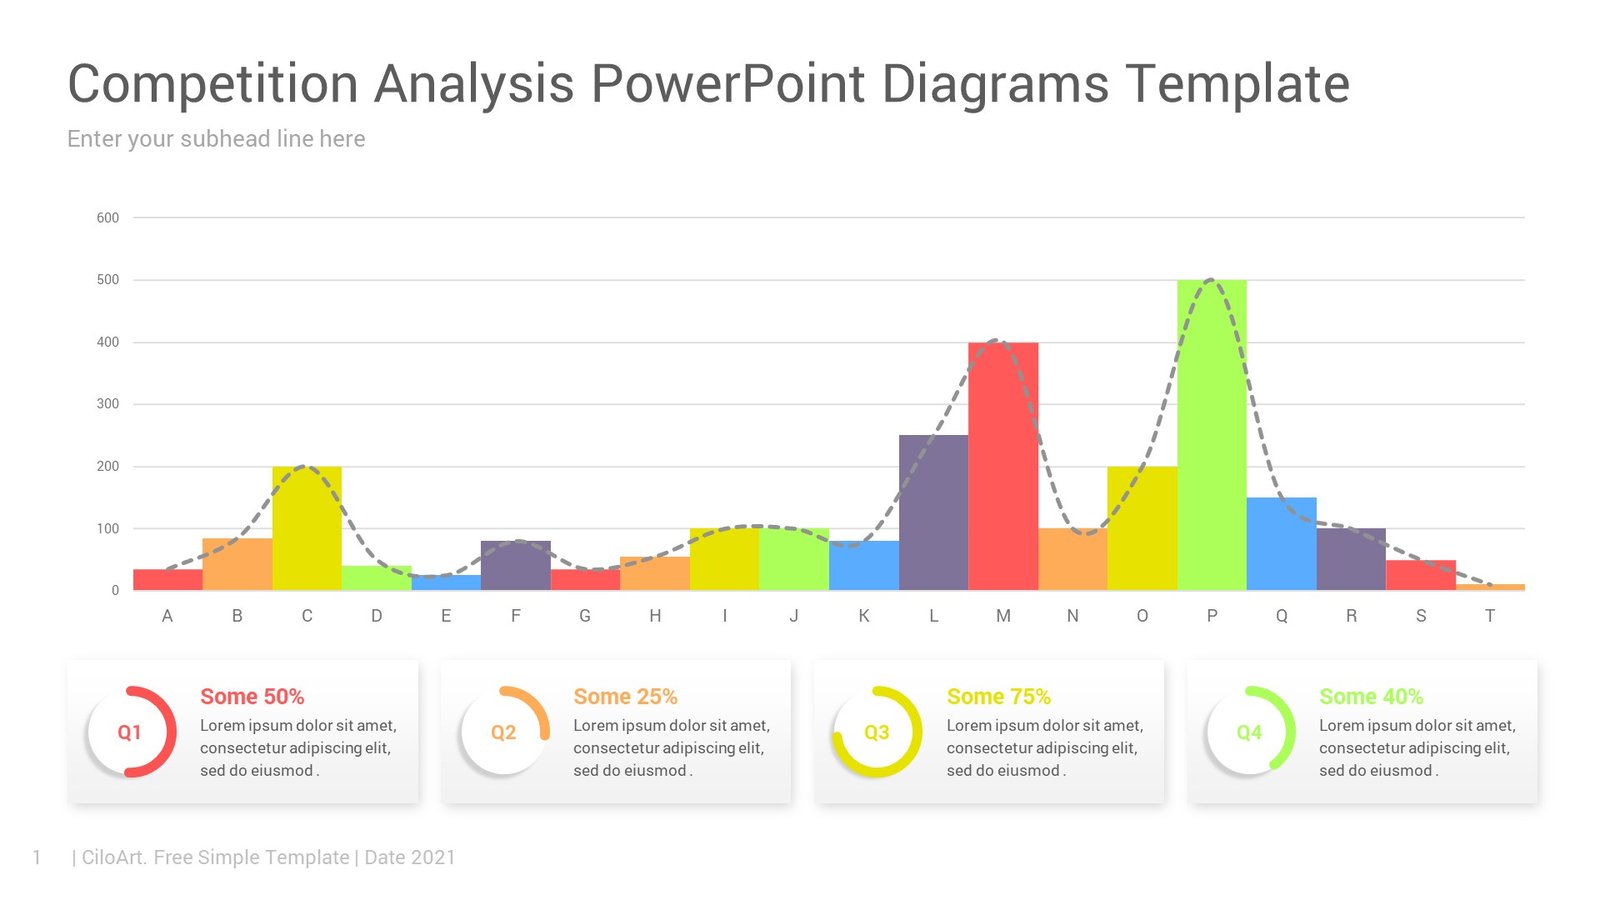
Competition Analysis PowerPoint Diagrams Template to convert your data visually into an amazing presentation. With fully editable slides, infographics, and diagrams. Competition analysis PowerPoint Diagrams
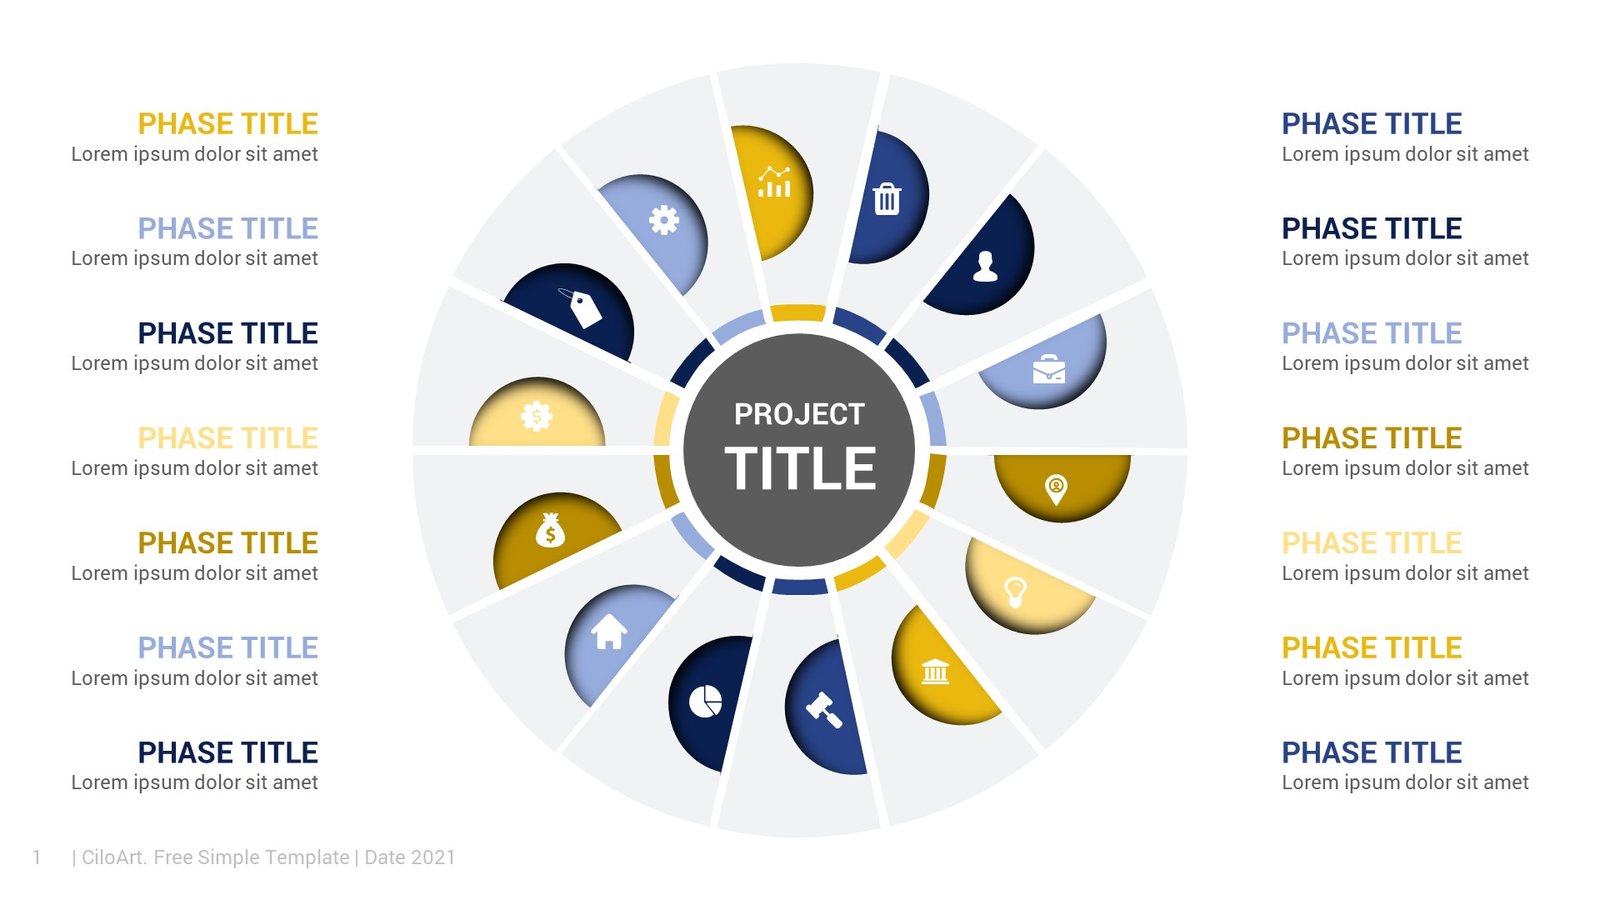
Process Cycle Diagram 14 Stages PowerPoint Diagrams to convert your data visually into an amazing presentation. With fully editable slides, infographics, and diagrams. Process Flow
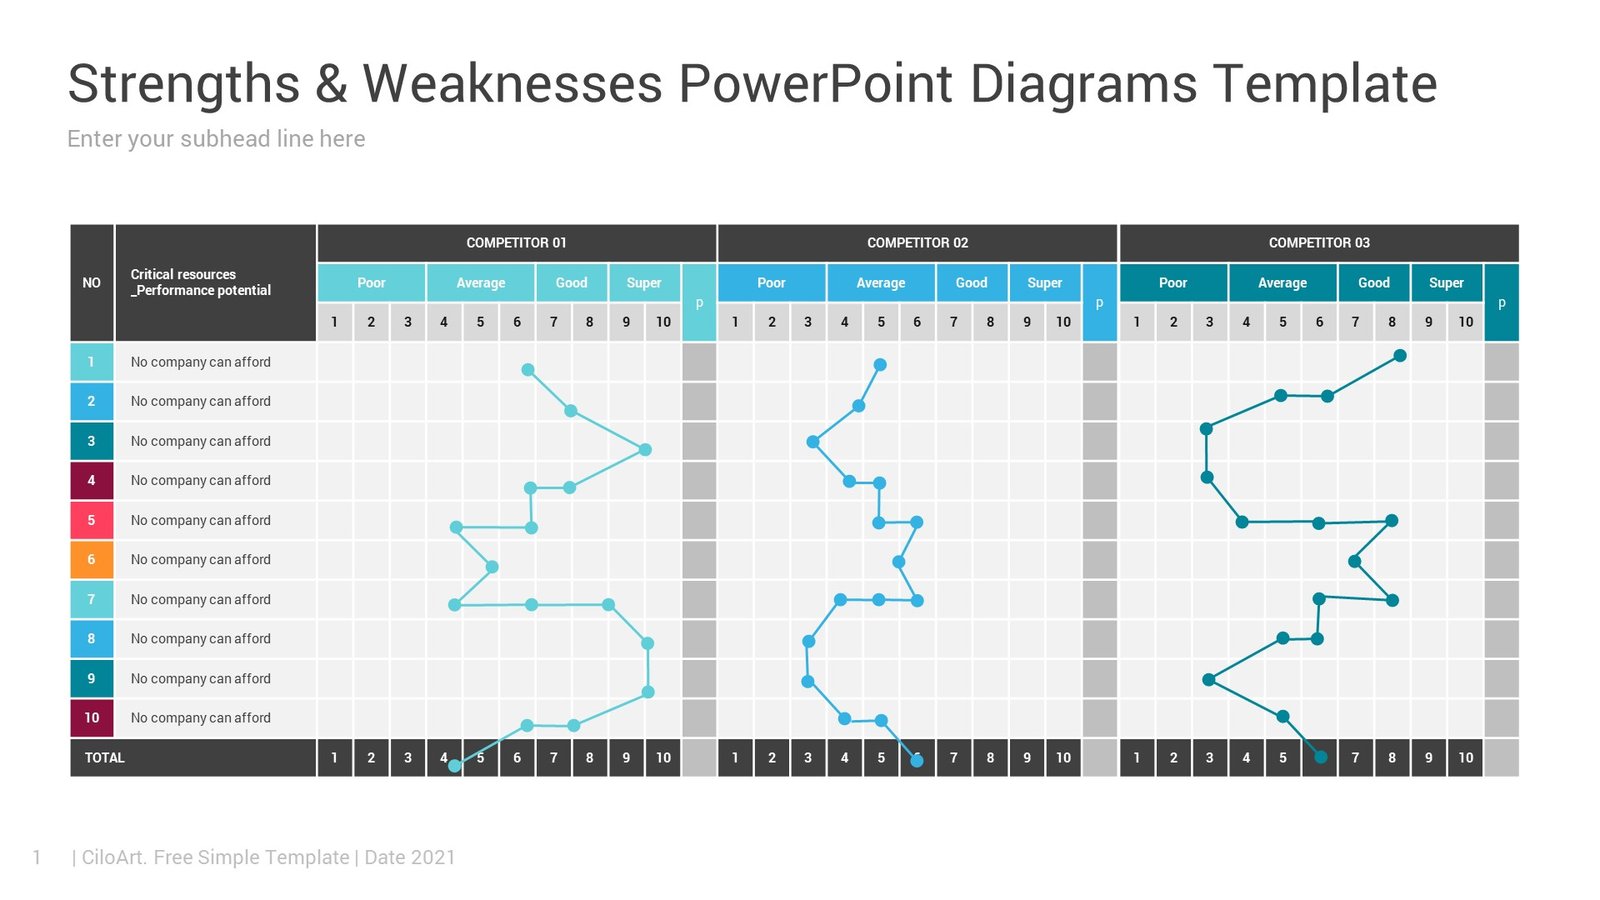
Strengths & Weaknesses PowerPoint Diagrams to convert your data visually into an amazing presentation. With fully editable slides, infographics, and diagrams. Strength and Weakness visualization PowerPoint

Competitors’ Objectives PowerPoint Diagrams to convert your data visually into an amazing presentation. With fully editable slides, infographics, and diagrams. Competitor’s objectives and agenda infographics is
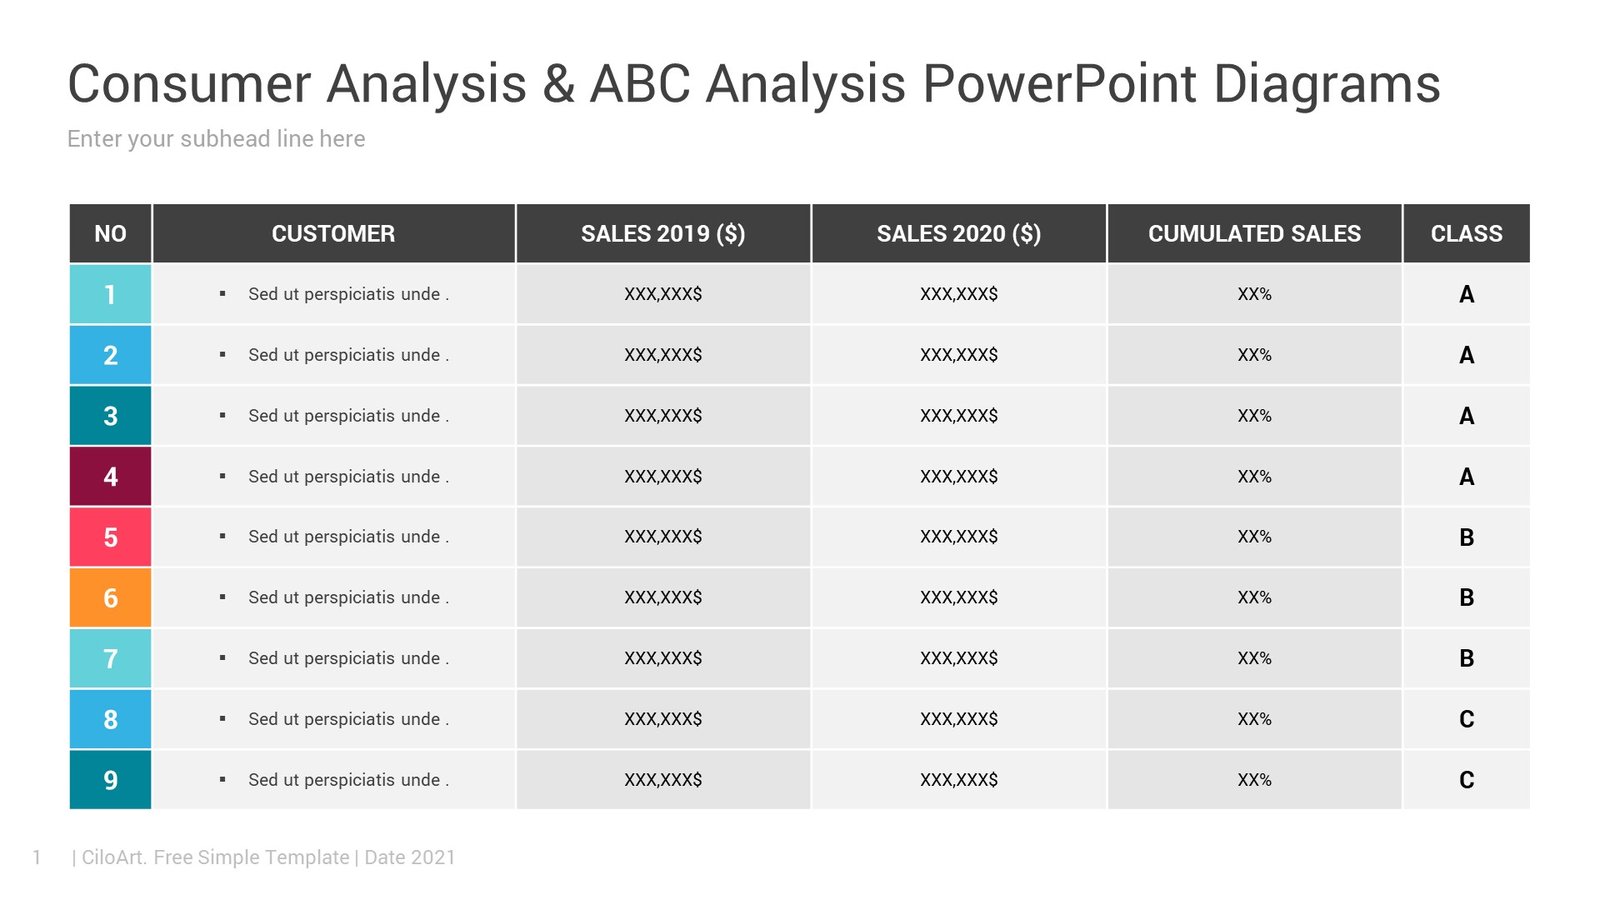
Consumer Analysis & ABC Analysis PowerPoint Diagrams to convert your data visually into an amazing presentation. With fully editable slides, infographics, and diagrams. What is

Creative 3 Levels Inverted Pyramid Infographic to convert your data visually into an amazing presentation. With fully editable slides, infographics, and diagrams. Creative three level inverted
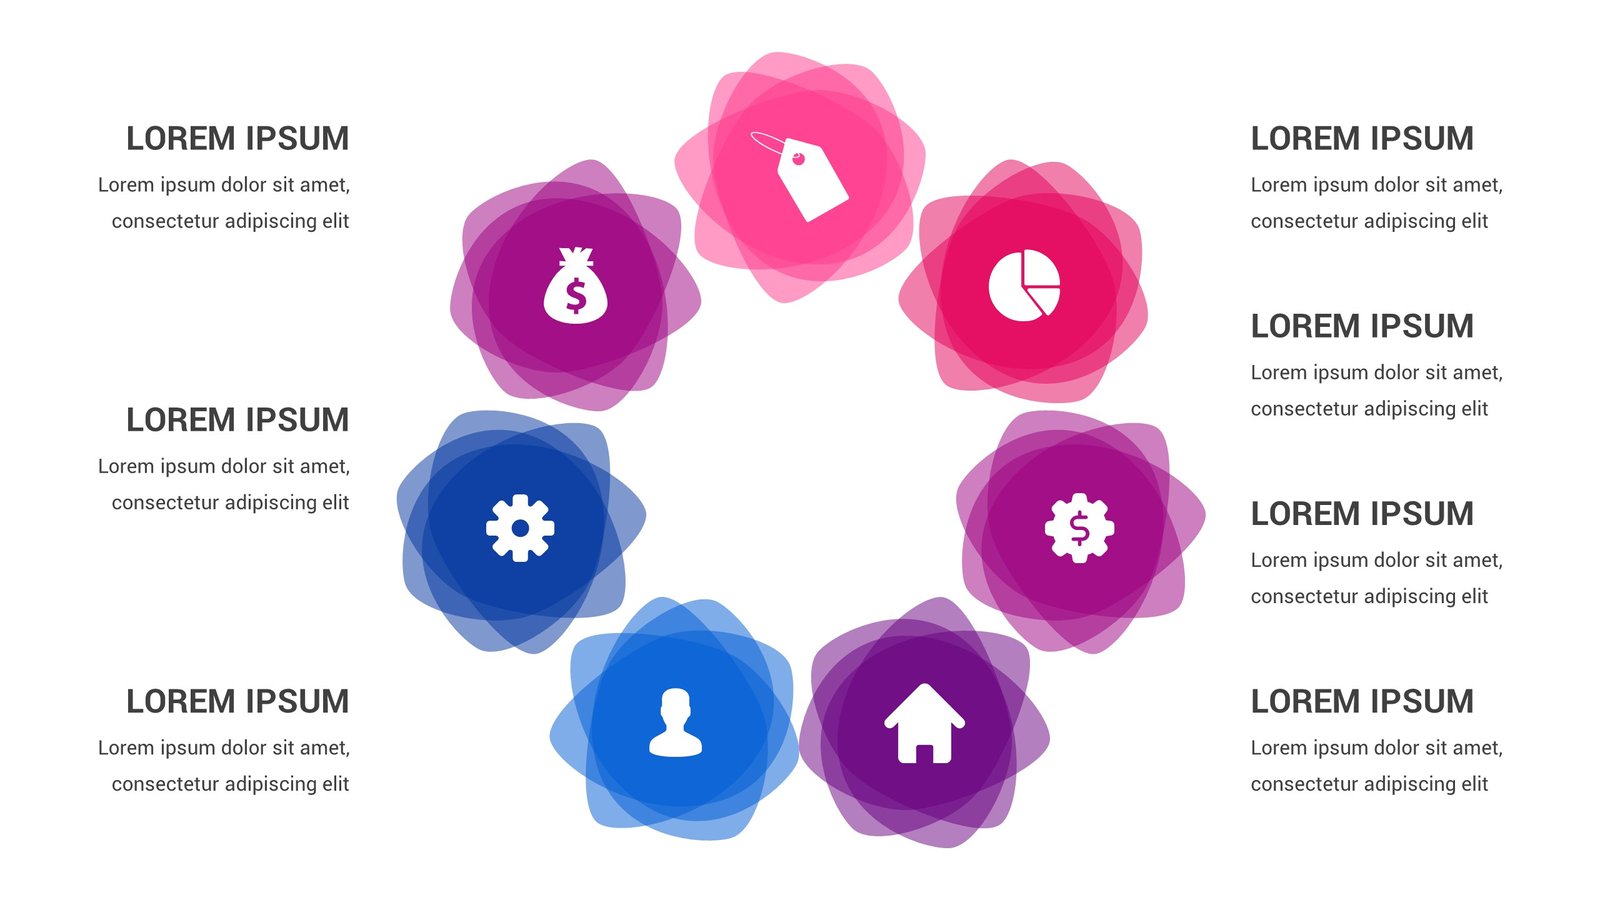
Creative 7 Steps Watercolor Free PowerPoint Infographic to convert your data visually into an amazing presentation. With fully editable slides, infographics, and diagrams. Creative Seven Steps
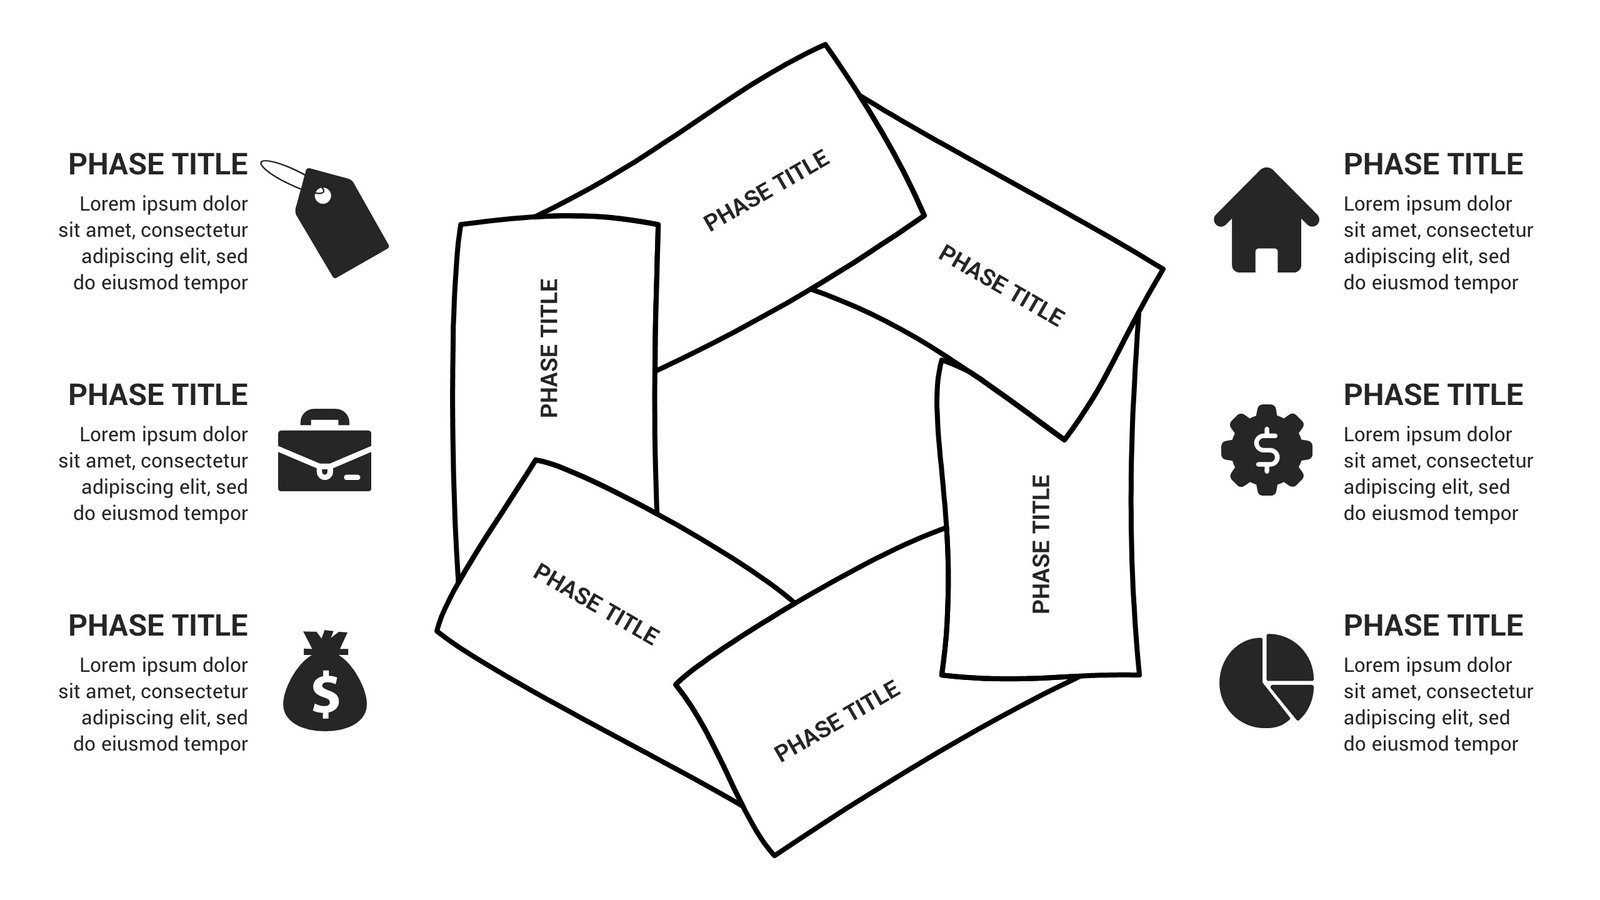
Creative 6 Steps Doodle Free PowerPoint Infographic to convert your data visually into an amazing presentation. With fully editable slides, infographics, and diagrams. Doodle Circular infographics
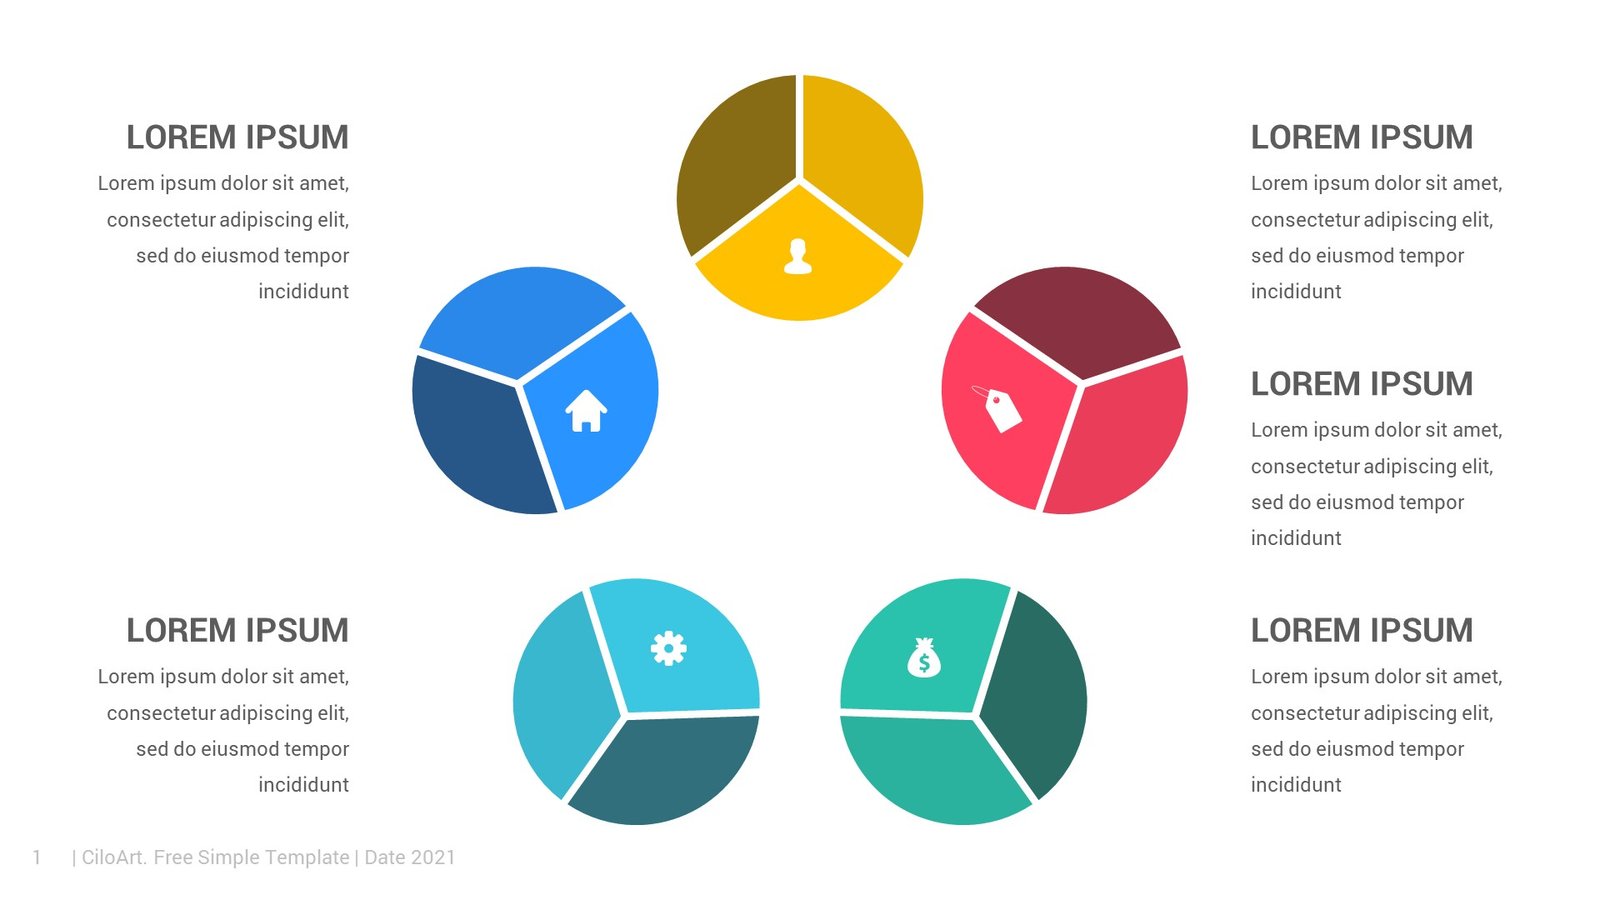
5 Steps Circular PowerPoint Infographics Template to convert your data visually into an amazing presentation. With fully editable slides, infographics, and diagrams. Circular Five Step