Single Slide
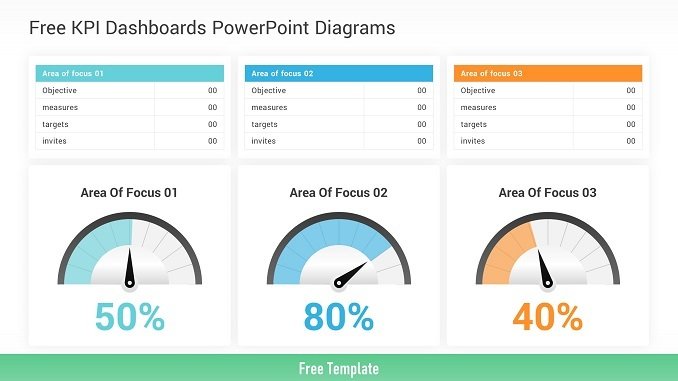
Free KPI Dashboards
Big Collection of KPI Dashboard slides to convert your data visually into an amazing presentation. With 30 fully editable slides, infographics, and diagrams. Over 5500
Big Collection of KPI Dashboard slides to convert your data visually into an amazing presentation. With 30 fully editable slides, infographics, and diagrams. Over 5500
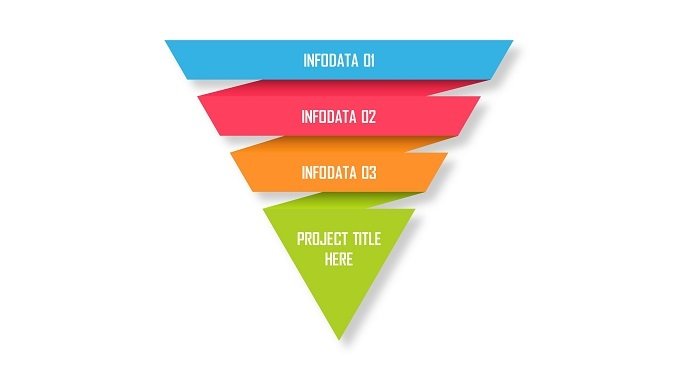
Creative 4 Levels Inverted Pyramid Infographic to convert your data visually into an amazing presentation. With fully editable slides, infographics, and diagrams. This Infographic Template is
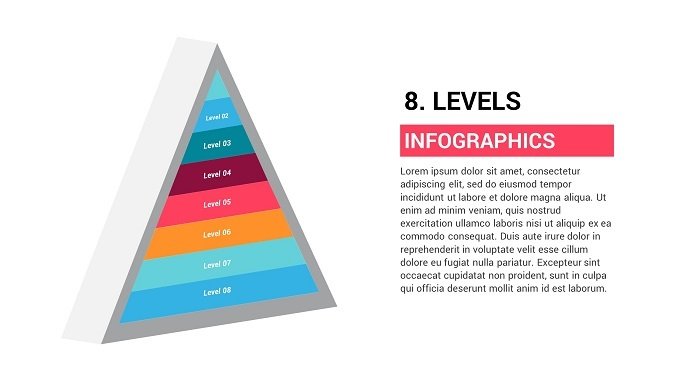
Creative 3D pyramid with 8 levels infographic to convert your data visually into an amazing presentation. With fully editable slides, infographics, and diagrams. This Infographic Template
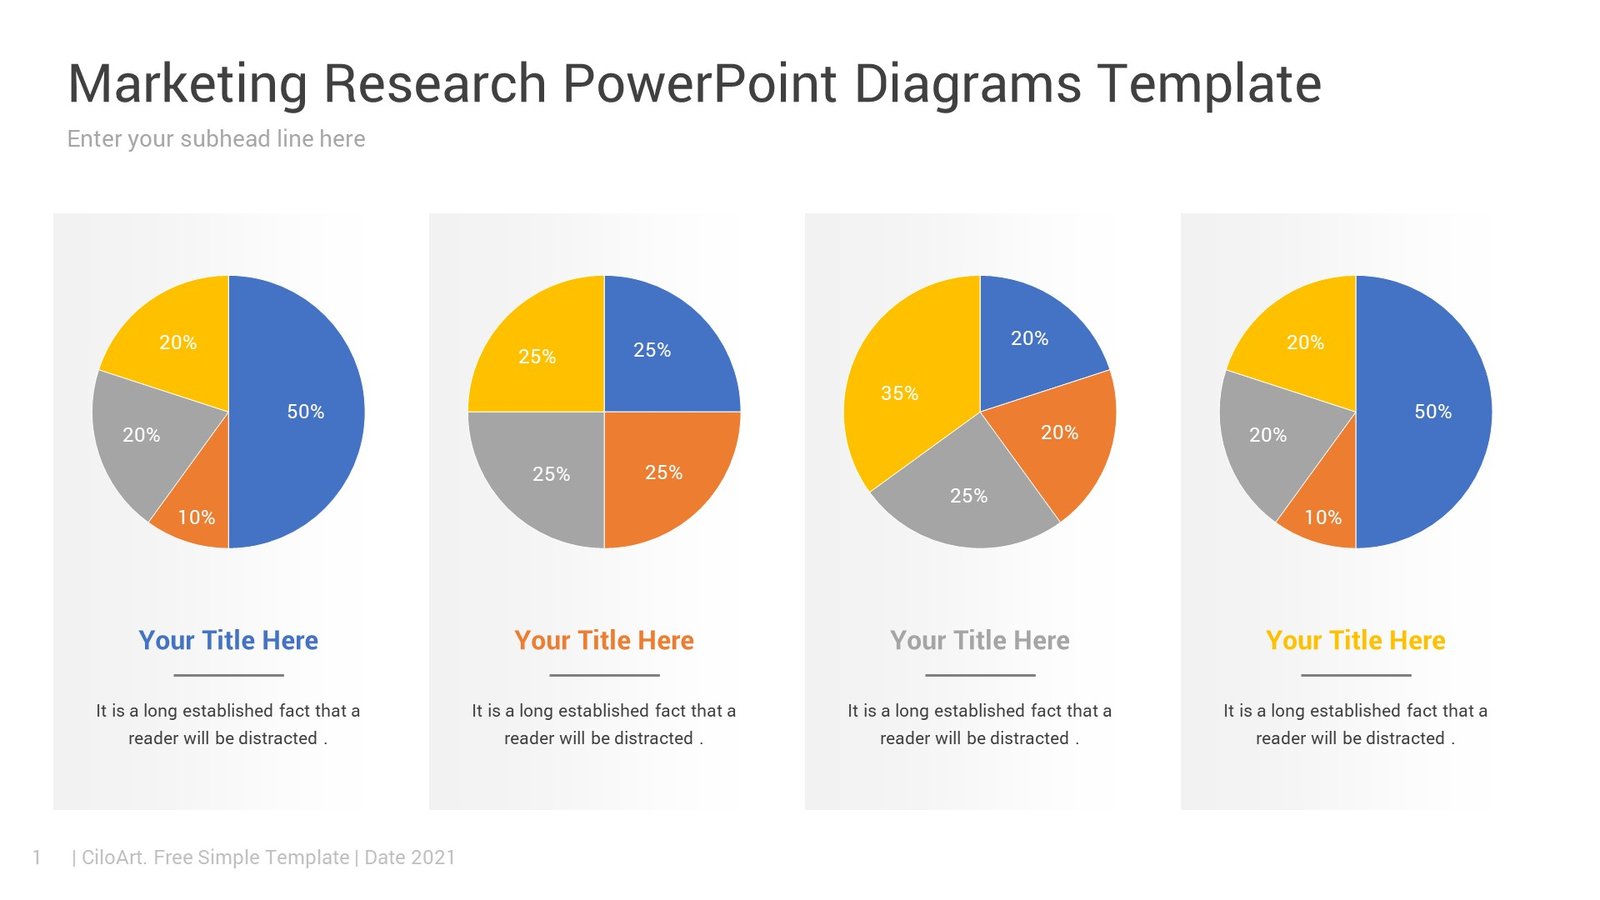
Marketing Research PowerPoint Diagrams Template to convert your data visually into an amazing presentation. With fully editable slides, infographics, and diagrams. Marketing Research Results Infographics
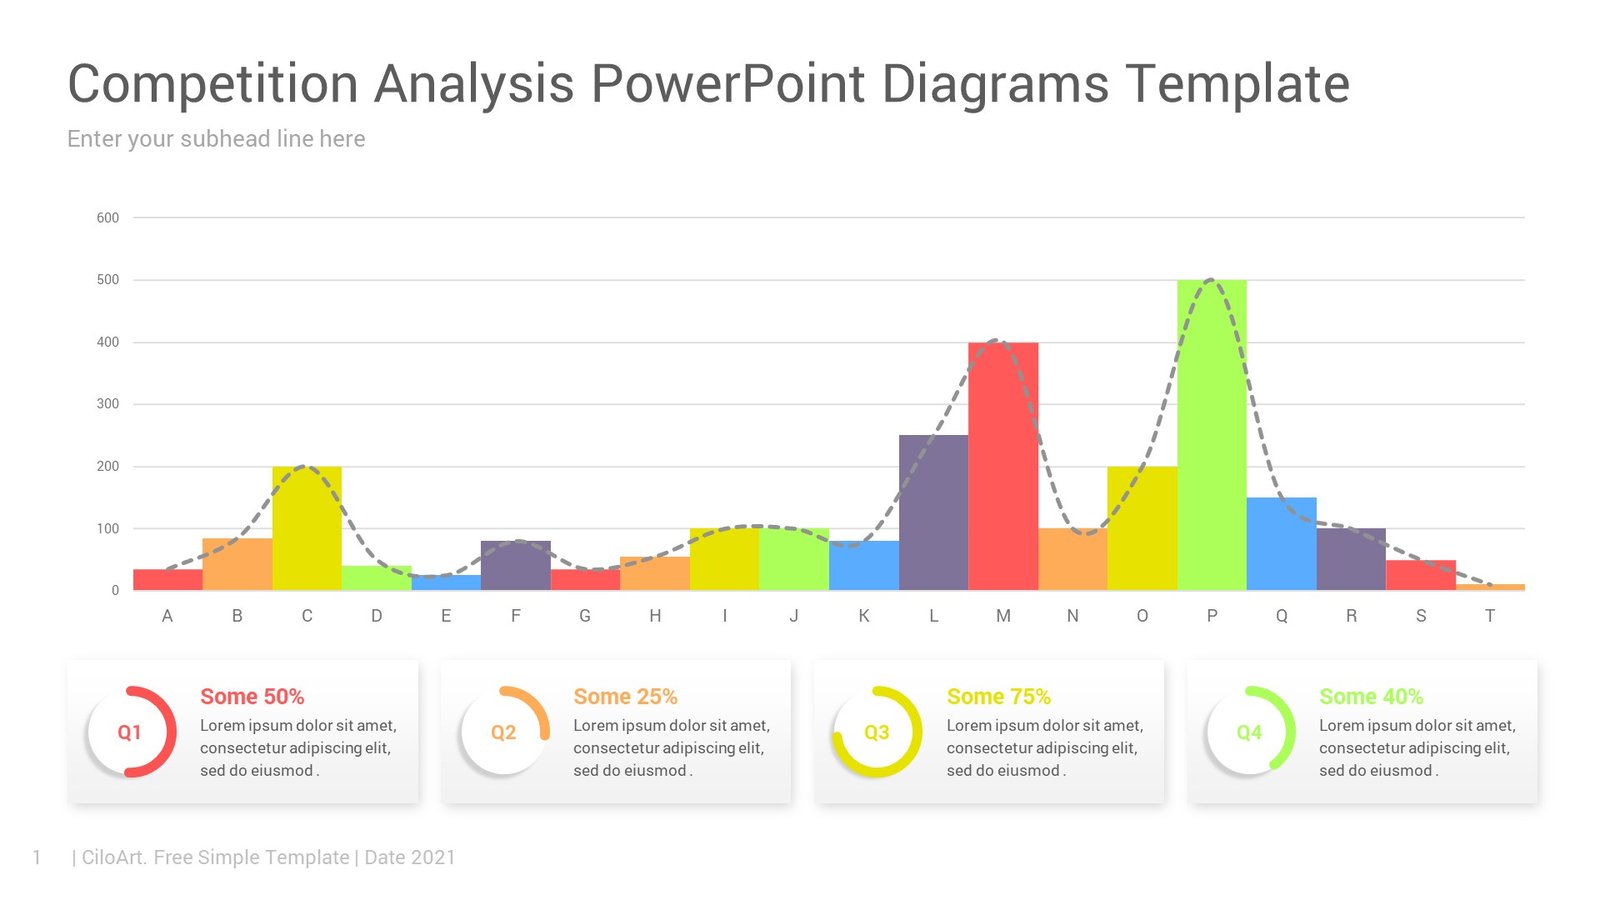
Competition Analysis PowerPoint Diagrams Template to convert your data visually into an amazing presentation. With fully editable slides, infographics, and diagrams. Competition analysis PowerPoint Diagrams
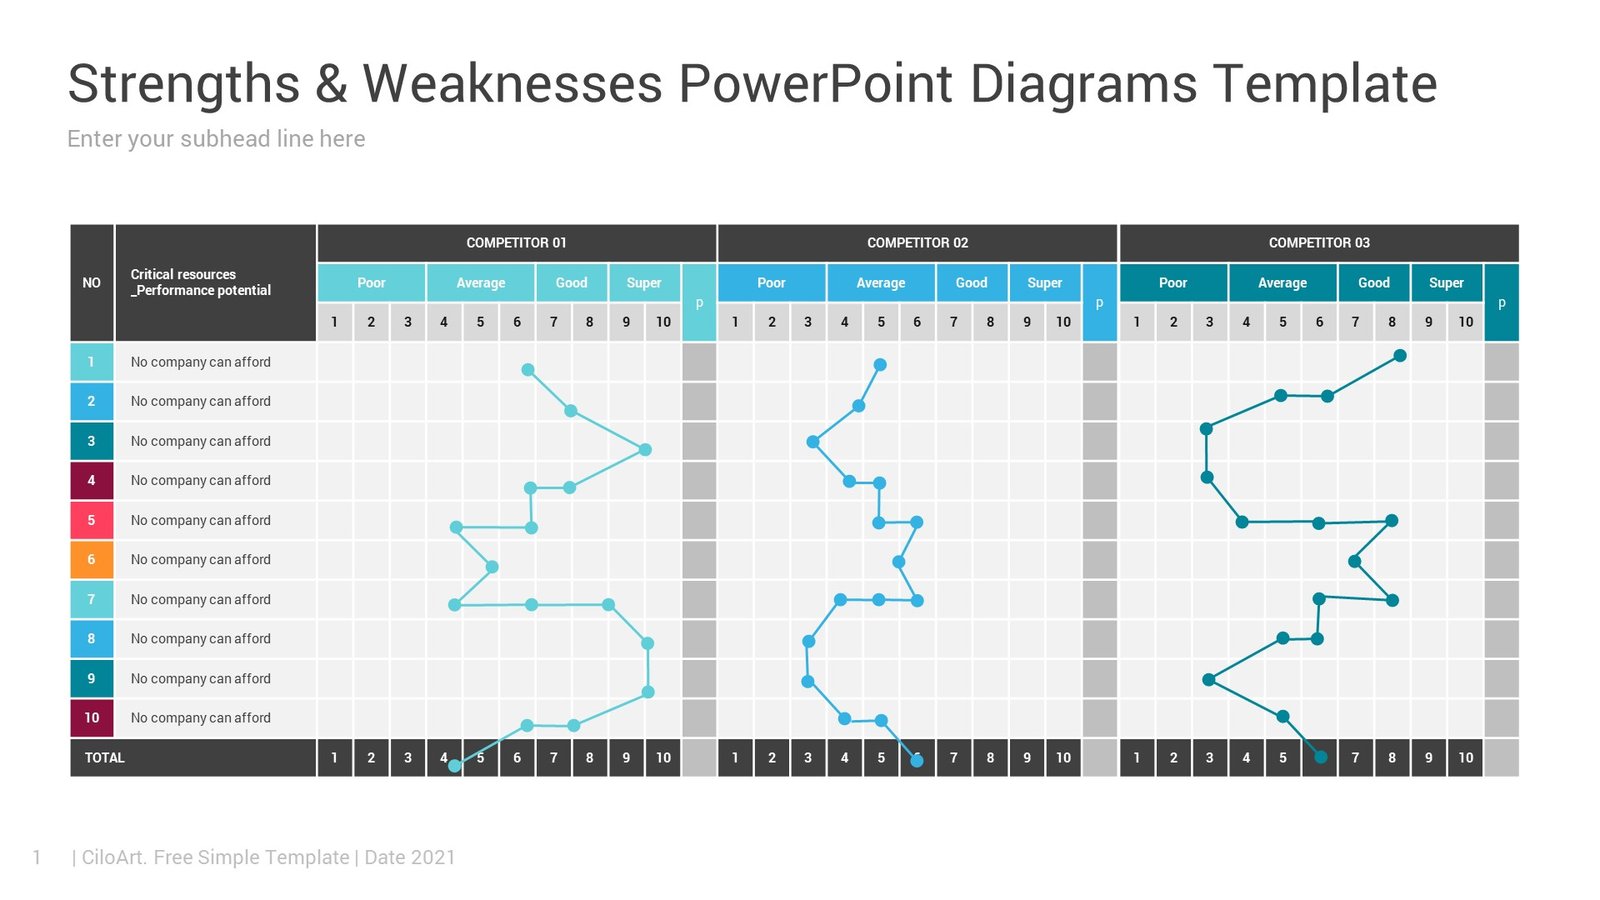
Strengths & Weaknesses PowerPoint Diagrams to convert your data visually into an amazing presentation. With fully editable slides, infographics, and diagrams. Strength and Weakness visualization PowerPoint

Competitors’ Objectives PowerPoint Diagrams to convert your data visually into an amazing presentation. With fully editable slides, infographics, and diagrams. Competitor’s objectives and agenda infographics is
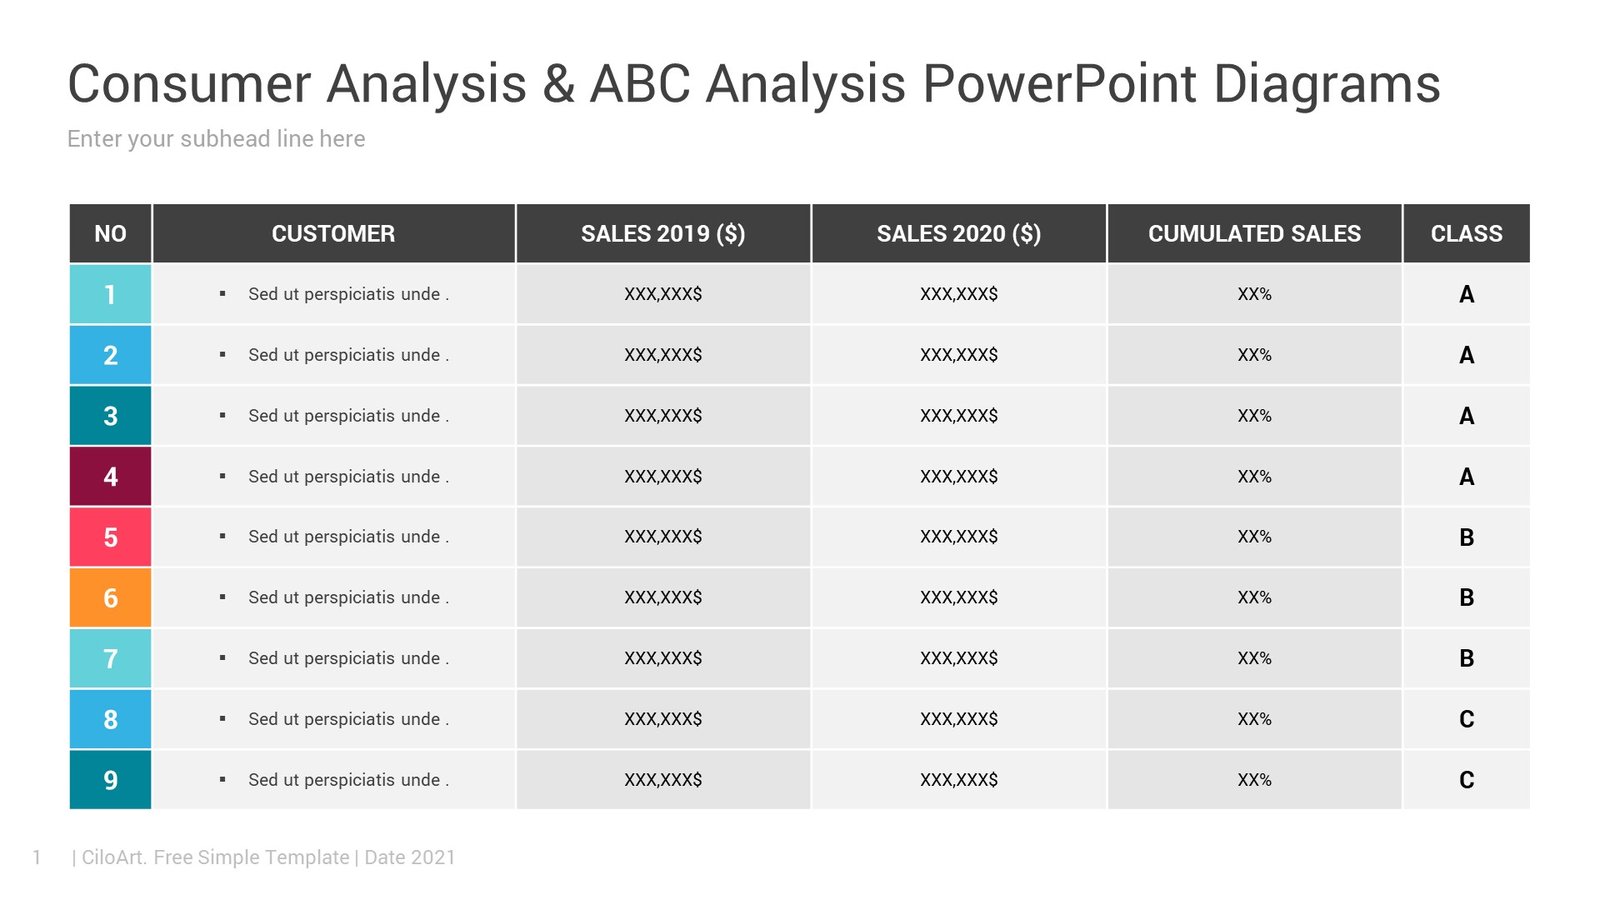
Consumer Analysis & ABC Analysis PowerPoint Diagrams to convert your data visually into an amazing presentation. With fully editable slides, infographics, and diagrams. What is
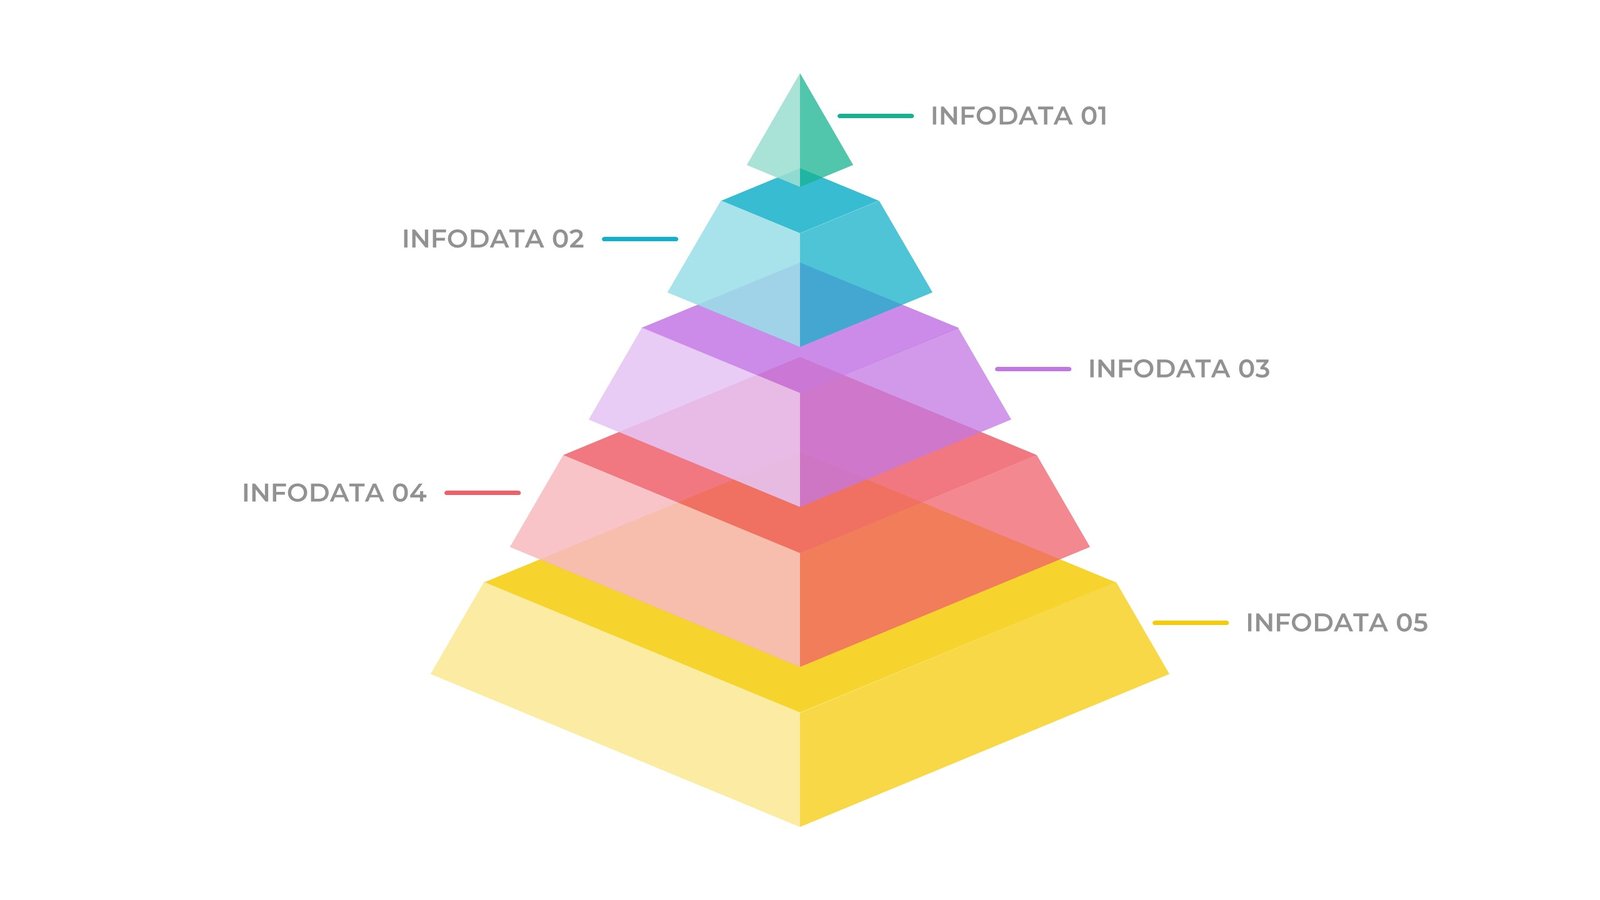
Transparent Pyramid Infographic Template with 5 Levels to convert your data visually into an amazing presentation. With fully editable slides, infographics, and diagrams. This pyramid Info
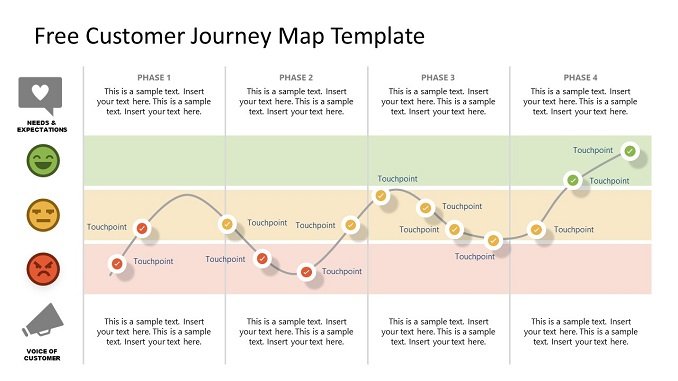
Customer journey map is a PowerPoint customer experience mapping infographic design. Customer journey map is also known as User journey map. This template is relevant
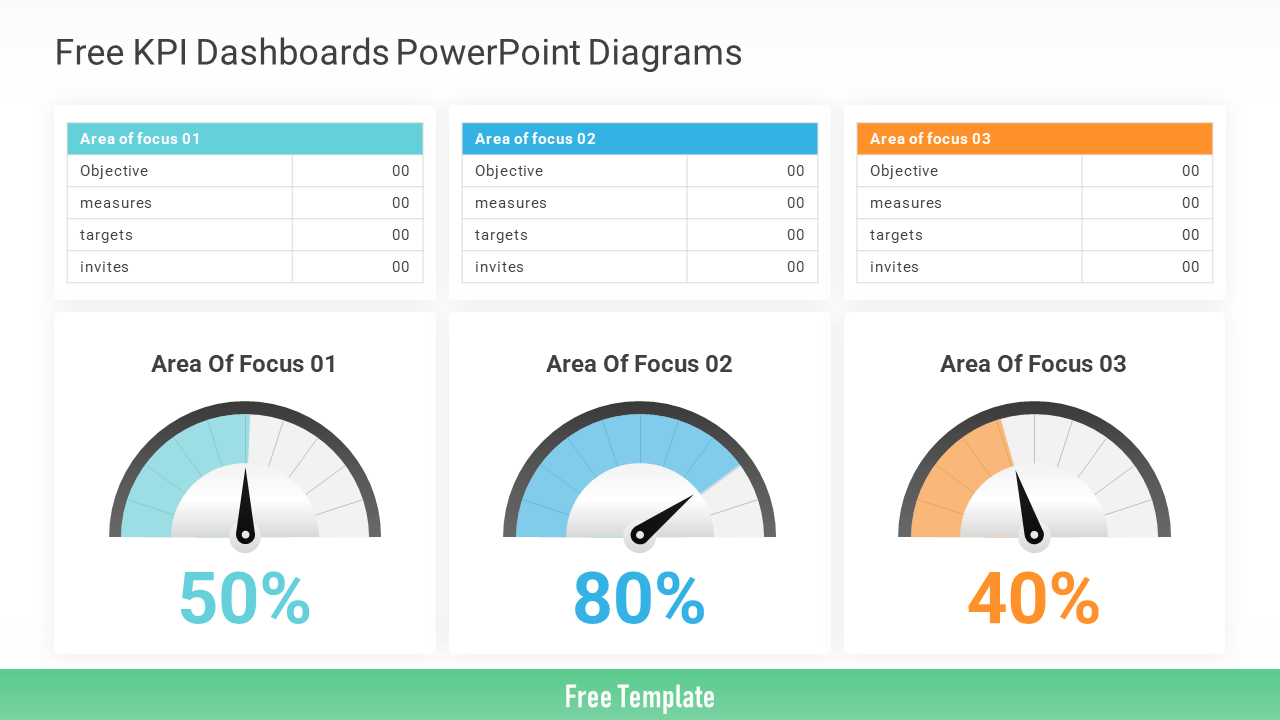
This free KPI Dashboard reporting slide is easy to download. It is useful for presenting key performance report basis your defined key performance indicator, KPI. You
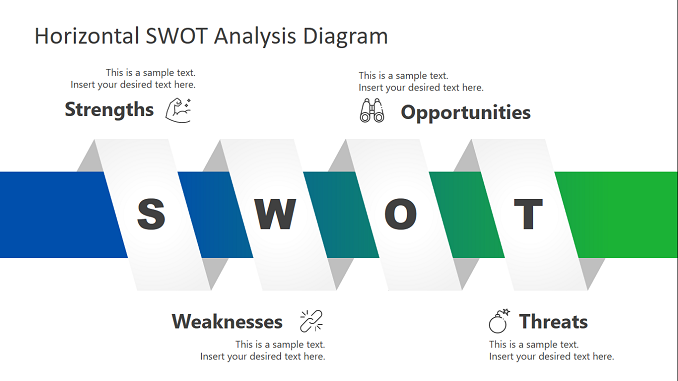
The Free Horizontal SWOT Analysis Diagram Template is a useful starting point for strategic analysis. You can customize the PowerPoint slides for various business presentations.