
Multi Slides
Thermometer & Temperature Infographics
The Free Thermometer Slides for PowerPoint show rising and lowering temperatures in mercury thermometers. The sun icon represents rising temperature whereas the snowflake suggests winter
The Free Thermometer Slides for PowerPoint show rising and lowering temperatures in mercury thermometers. The sun icon represents rising temperature whereas the snowflake suggests winter

In business operations, a bottleneck refers to the point where production is not meeting maximum throughput capacity. It could lead to delay or halt on
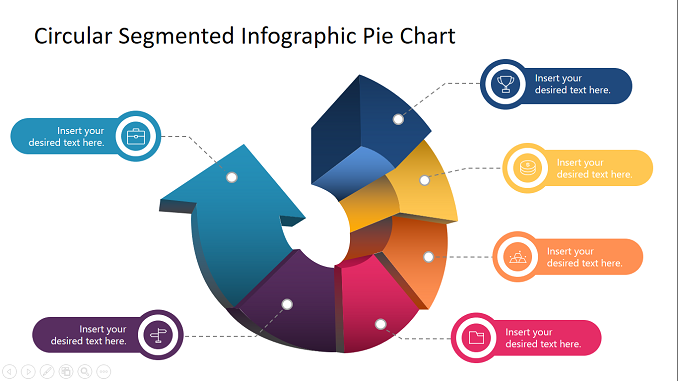
The Pie chart assists in explaining complex data using an easy-to-understand visual diagram. It is commonly used to describe numeric data with different values. The pie
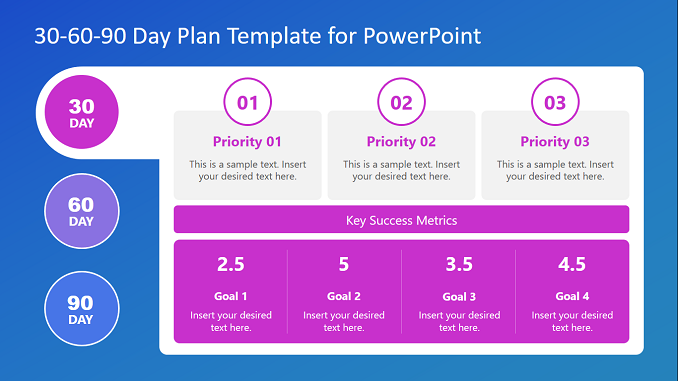
A simple 30 60 90 day plan template for PowerPoint is a business presentation tool. It assists presenters to map out the main goals and deliverables of
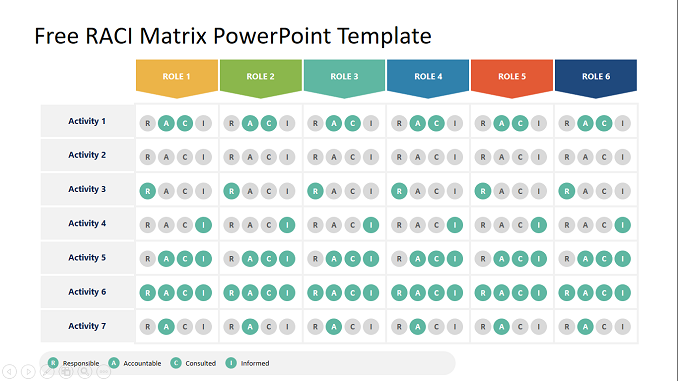
In project management, formulating and delegating the roles and responsibilities can get difficult. Businesses use the organizational hierarchy model to explain the roles and responsibilities

Mind Map infographics is a free editable mind map template for PowerPoint and google slides. This concept map PowerPoint template comes with two slide designs.
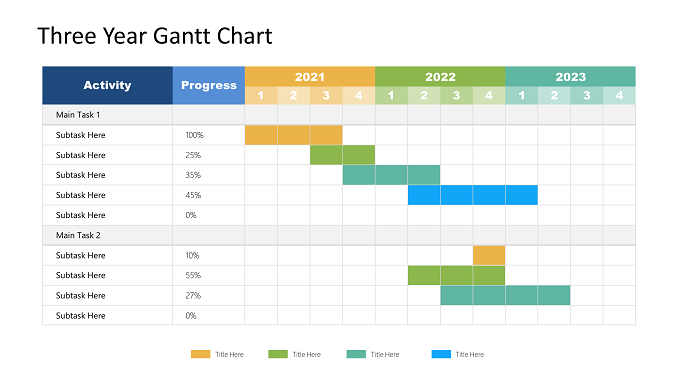
Gantt chart templates are ideal for providing an estimate of project delivery. You can use Gantt chart template to present how long it will take
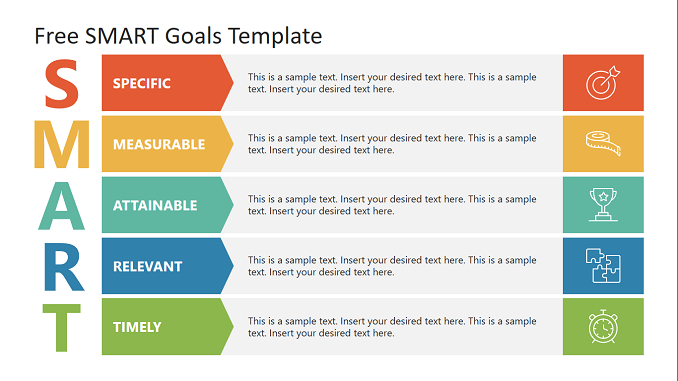
Goal setting has various methods in an organization. One being, SMART Goals. This presentation template for PowerPoint, OpenOffice and Google Slides, is relevant for SMART
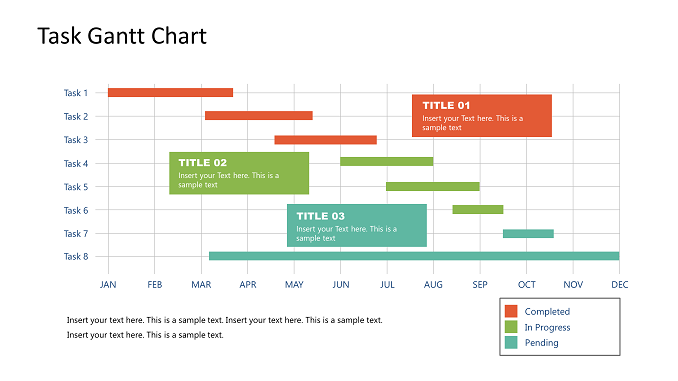
The Free Gantt Chart PowerPoint Templates are easy-to-use slides with attractive designs. Alternative to the simple Gantt charts in project management applications, these templates are
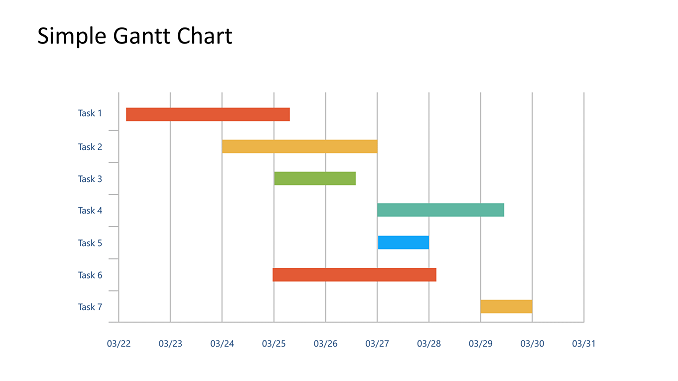
The Free Gantt Chart PowerPoint Templates are easy-to-use slides with attractive designs. This is a simple Gantt chart presentation design. You can explore other Gantt
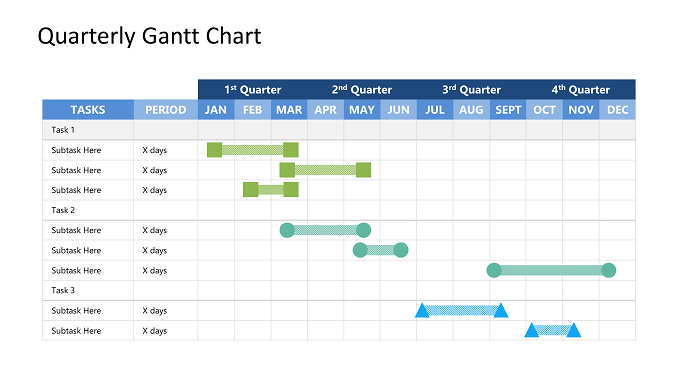
The Free Gantt Chart PowerPoint Templates are easy-to-use slides with attractive designs. Alternative to the simple Gantt charts in project management applications, these templates are
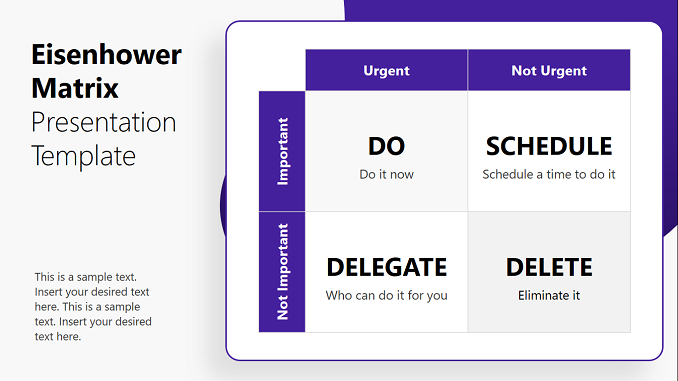
The Free Eisenhower Matrix PowerPoint Template is a productivity model presentation. It presents a 2×2 matrix in PowerPoint to show a comparison of urgent and important work.